
Bitcoin’s recent market activity is showing a significant shift in investor behavior, with exchange data pointing to reduced selling pressure despite BTC trading above the $100,000 mark. Coupled with a key technical indicator being reclaimed, analysts suggest potential upside for the cryptocurrency.
Contents
The core takeaway is that Bitcoin inflows to major exchanges like Binance are at levels not seen since previous bear markets, signaling that holders are less likely to sell. Meanwhile, Bitcoin’s price has moved back above a crucial technical average, a pattern historically associated with price rallies.
Reduced Selling Pressure as Bitcoin Inflows Hit Lows
Data from CryptoQuant highlights a notable trend: the 30-day moving average (DMA) of Bitcoin inflows to Binance recently fell to just 5,147 BTC. This figure is less than half the inflow levels observed during previous bear market periods and significantly lower than the 13,200 BTC recorded in December 2024 when Bitcoin was trading below $100,000.
Exchange inflows represent the amount of cryptocurrency moving onto trading platforms, often interpreted as an indicator of potential selling pressure. Historically, large spikes in BTC inflows have coincided with periods of increased selling or market corrections, such as during the FTX collapse in late 2022, which saw monthly inflows surge due to panic selling.
 Chart showing Bitcoin's 30-day moving average of inflows to Binance exchange over time
The current low inflow figure, especially with Bitcoin trading well above $105,000, stands in stark contrast. It suggests that investors are choosing to hold their Bitcoin rather than move it to exchanges for potential sale, reducing the immediate supply available to the market. Bitcoin researcher Axel Adler Jr. further noted that the inflow/outflow ratio remains strong, comparable to the start of the recent bull market phase, indicating persistent demand for BTC.
This decline in selling pressure, indicated by the low inflows, creates a more favorable environment for potential price appreciation, assuming demand remains constant or grows.
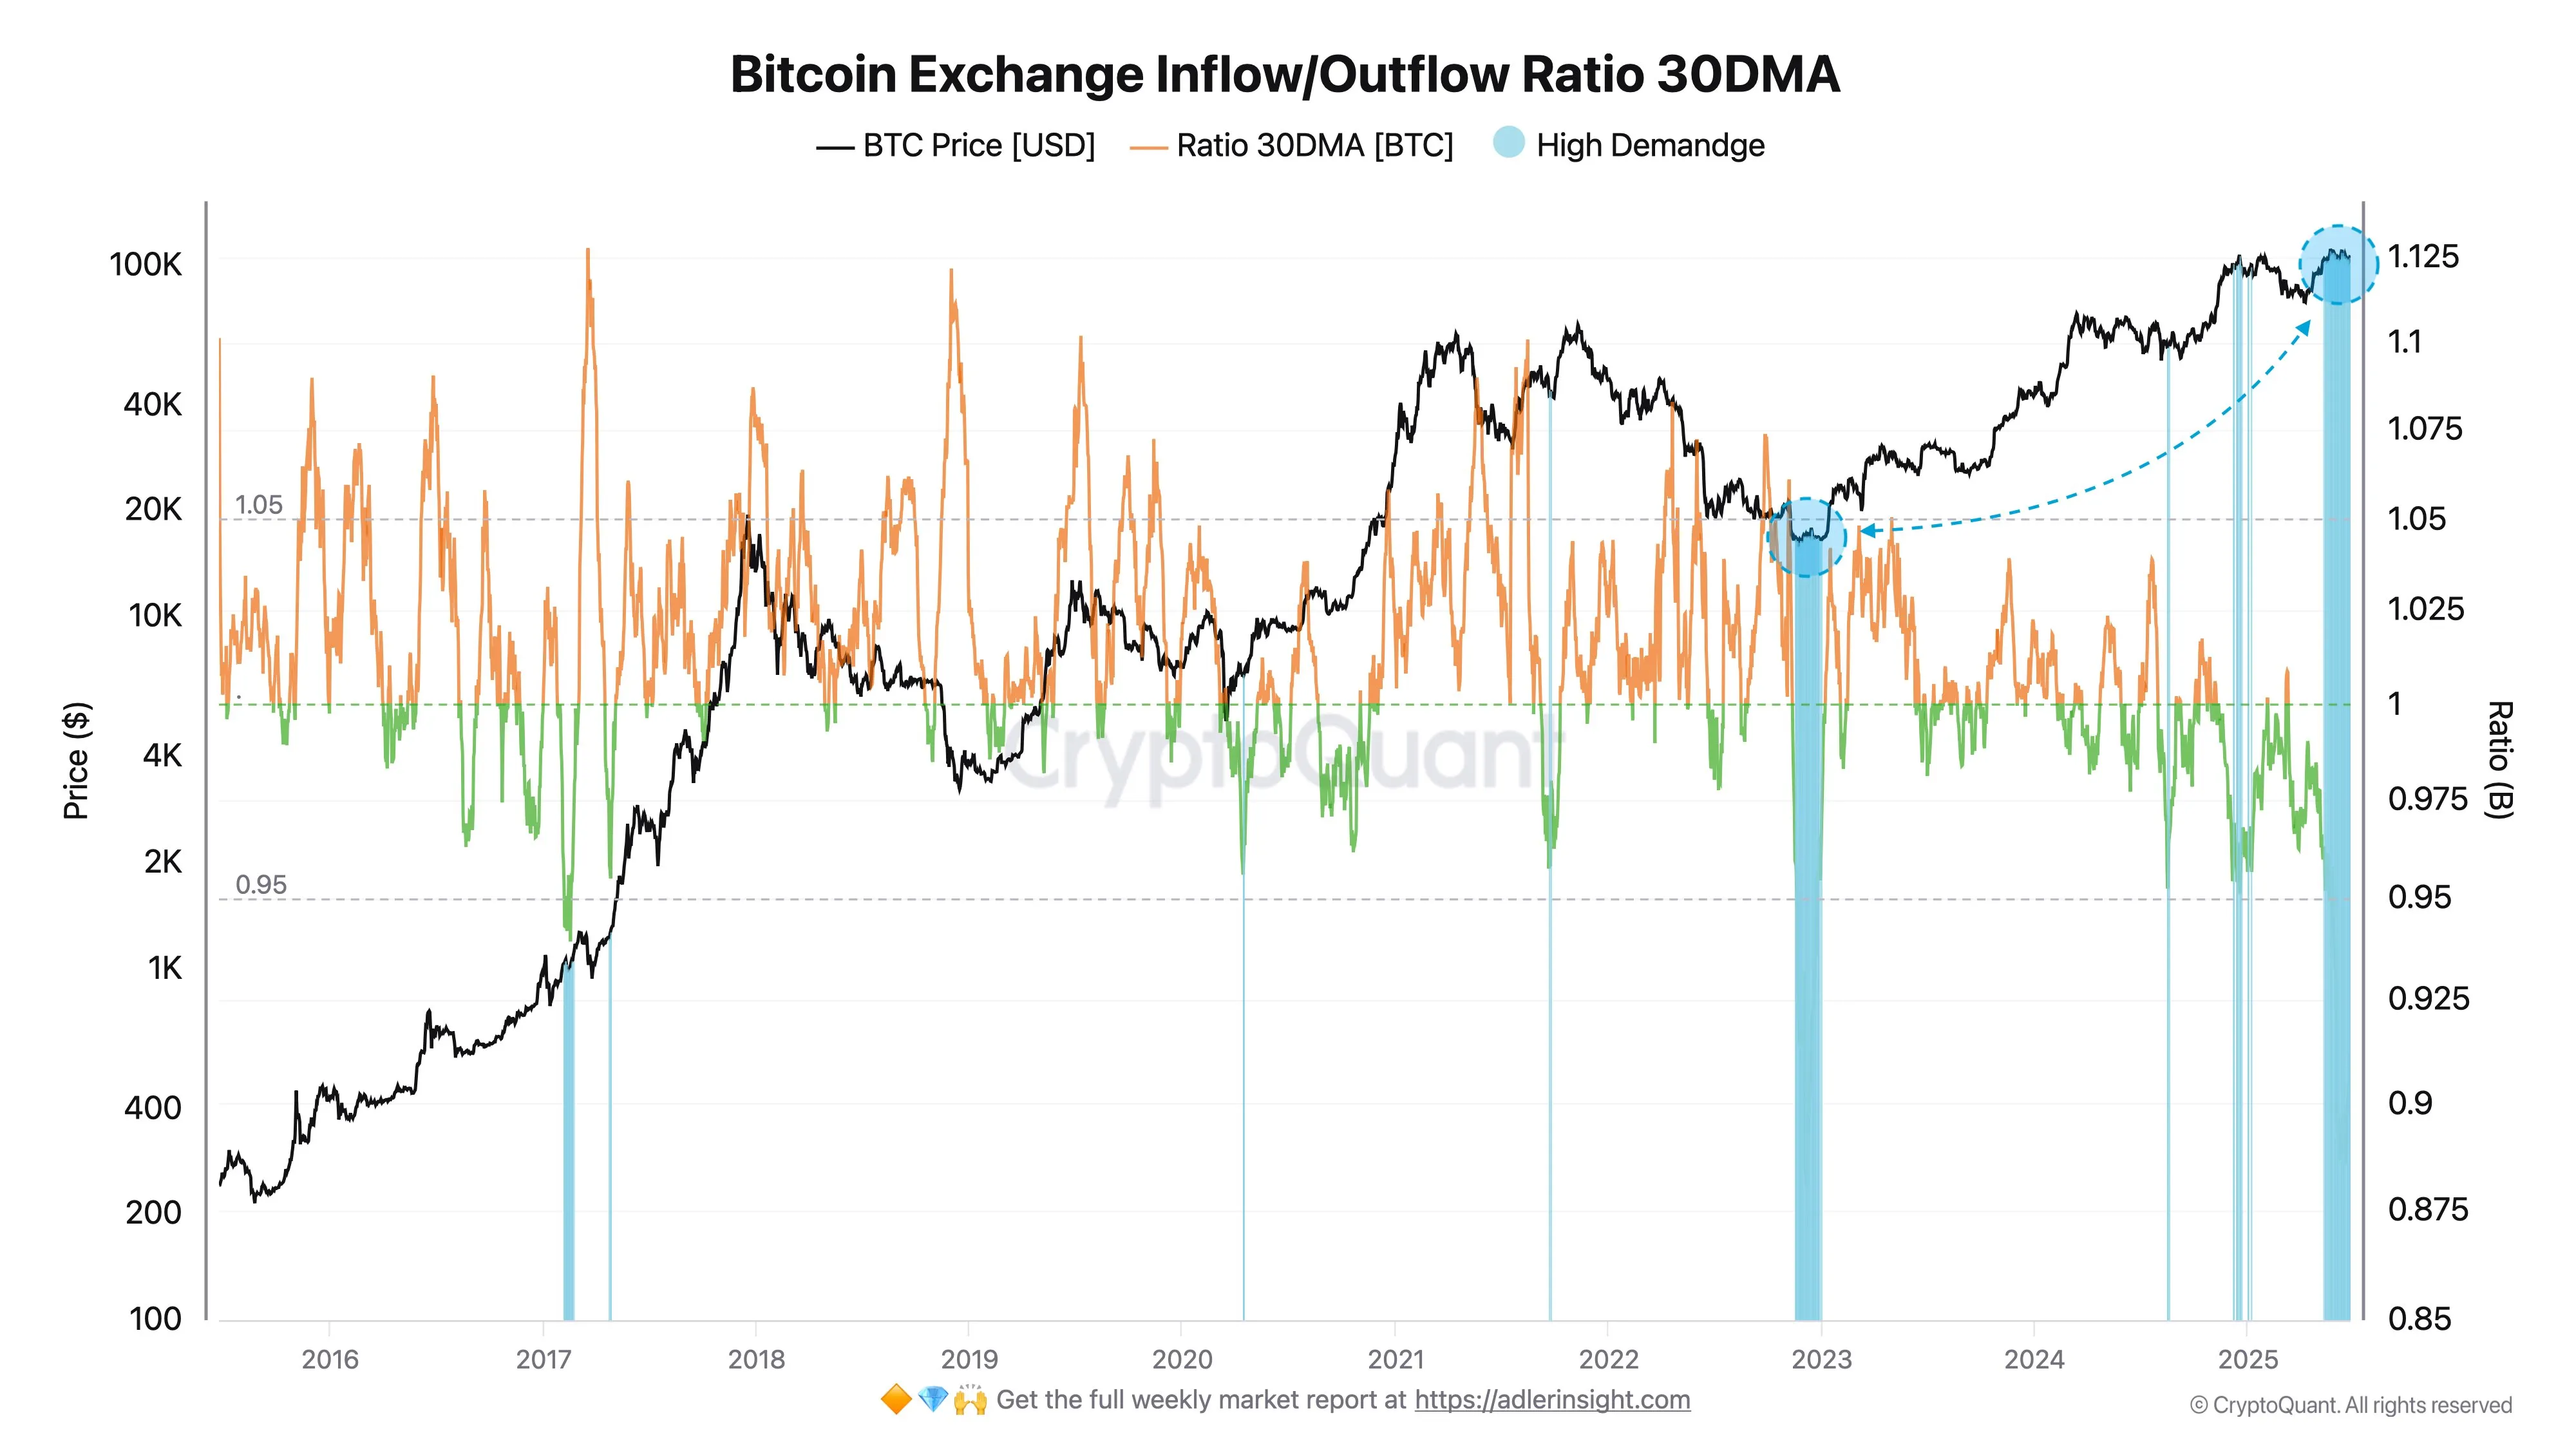 Graph illustrating the Bitcoin exchange inflow/outflow ratio over time, highlighting periods of high demand
Explore the difference between exchange inflows and outflows in our detailed guide.
Bitcoin Reclaims Key Technical Level, Targets $120,000?
Adding to the bullish signals, Bitcoin has recently reclaimed its 50-day exponential moving average (EMA), a technical line closely watched by traders. According to crypto trader Ibrahim Cosar, the 50-day EMA has historically served as strong support during price dips within established uptrends. He observes a pattern where brief drops below this average, followed by a quick recovery and close above it, often precede significant price rallies of 10% to 20%.
Cosar highlights that after a recent pullback, Bitcoin briefly dipped below the 50-day EMA but has since recorded three consecutive daily closes above it. This “reclaim,” he suggests, is typically a bullish indicator mirroring setups that triggered upward moves in the past, potentially paving the way for a rally towards the $120,000 mark.
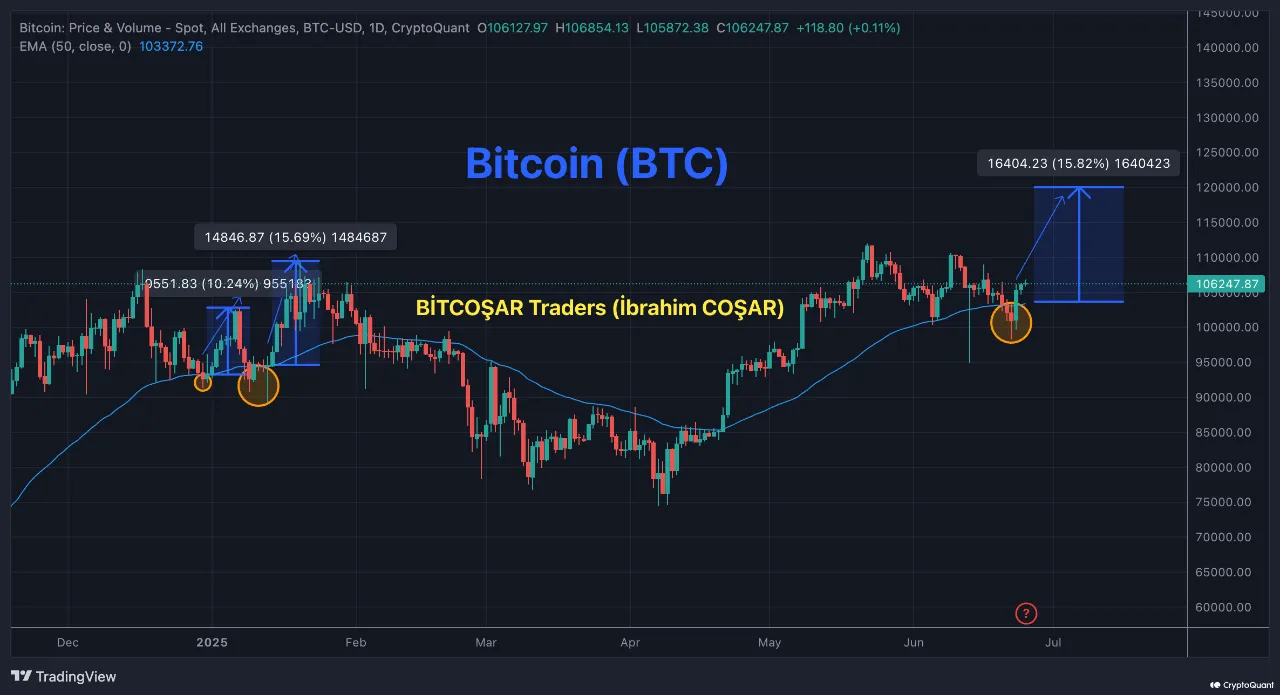 Bitcoin daily price chart showing the 50-day exponential moving average and potential future price movement
Supporting this technical outlook, crypto commentator IT Tech points to a rising cumulative volume delta (CVD) spot indicator. The CVD measures the net difference between buying and selling volume, providing insight into the dominant market force. A rising spot CVD indicates strong buying pressure in the spot market, suggesting that demand is absorbing available supply around the current price levels, including above $108,000.
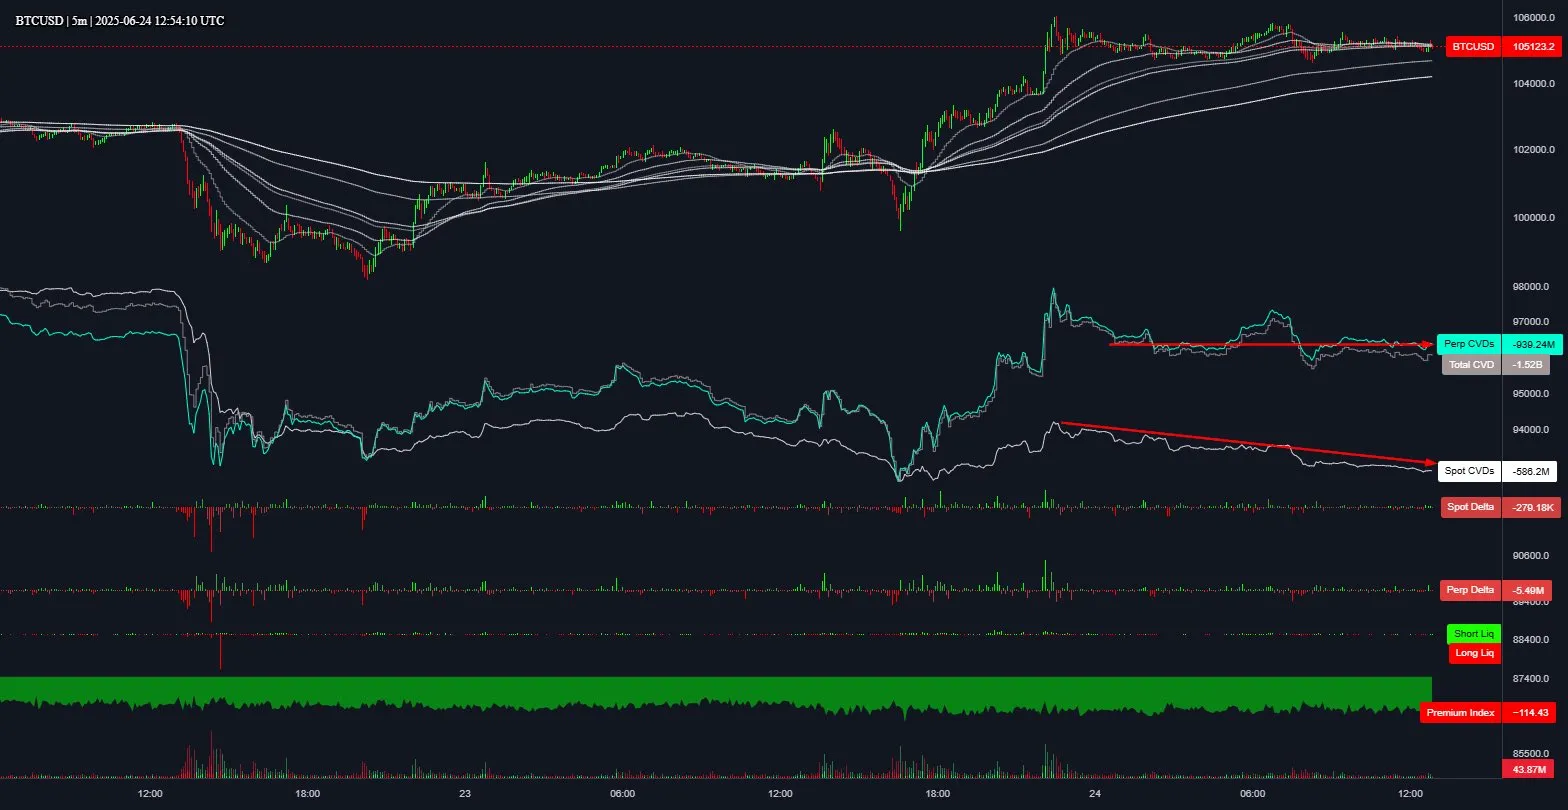 Analysis of Bitcoin price and cumulative volume delta (CVD) indicating strong spot buying pressure
Catch up on recent Bitcoin price analysis predicting potential moves.
What’s Next for Bitcoin?
The combination of low exchange inflows – signaling reduced immediate selling pressure – and the reclaim of a critical technical average like the 50-day EMA paints a potentially bullish picture for Bitcoin in the short to medium term. The strong spot buying indicated by the rising CVD further supports the idea that demand is currently outpacing supply on exchanges.
While these signals point towards a foundation for potential price appreciation, the broader market remains subject to macroeconomic factors and unforeseen global events. Investors should weigh these technical and on-chain indicators against potential external shocks.
Stay informed with the latest updates on Bitcoin ETFs and market trends.