
The U.S. Federal Reserve is shifting monetary policy, moving from aggressively hiking interest rates to carefully cutting them. This pivot marks a significant change in the economic landscape and has major implications for investors, particularly those tracking the performance of the S&P 500 index. While lower interest rates are generally considered a tailwind for the stock market over the long term, history shows that the start of a rate-cutting cycle can sometimes coincide with temporary market turbulence. Understanding why this happens and what to watch for is key for navigating the current environment.
Contents
The Shift to Lower Rates Explained
For years, the Fed maintained historically low interest rates to stimulate the economy. However, a combination of factors stemming from the pandemic – including massive government stimulus spending and supply chain disruptions – caused inflation, measured by the Consumer Price Index (CPI), to surge to a 40-year high of 8% in 2022.
To combat this rapid price increase, the Fed embarked on a rapid series of rate hikes, lifting the federal funds rate from a low of 0.13% to a peak of 5.33% by mid-2023. These higher borrowing costs successfully cooled demand and helped bring inflation down. By 2024, the CPI increase had slowed significantly, registering 2.9%, and fell further to 2.4% by May 2025. With inflation nearing the Fed’s 2% target, the central bank began its rate-cutting cycle in September 2024, reducing the rate by a full percentage point by year-end. Policymakers currently anticipate two further cuts in 2025, a view largely shared by Wall Street forecasts like the CME Group’s FedWatch tool.
Understanding the Market’s Reaction
Lower interest rates are typically positive for the stock market. They reduce borrowing costs for companies, potentially boosting profits and making investments in growth more attractive. Additionally, lower rates on safe assets like bonds or savings accounts push investors towards riskier assets like stocks and real estate in search of better returns.
However, looking back over the past 25 years, the start of every major rate-cutting cycle has coincided with a temporary decline in the S&P 500. The market experienced a dip following the Fed’s recent cuts as well.
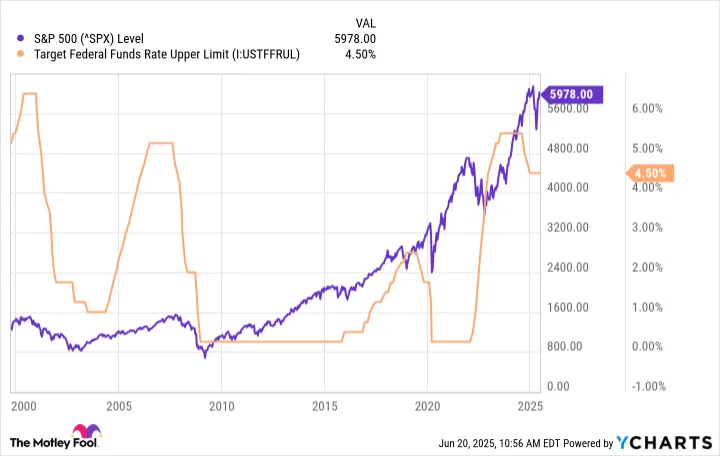 Chart illustrating the S&P 500 market performance following periods of Federal Reserve interest rate cuts.
This historical pattern isn’t a simple case of rate cuts causing stocks to fall. Instead, it often reflects why the Fed is cutting rates. Historically, deep rate-cutting cycles were triggered by significant economic shocks – the dot-com bubble burst in 2000, the global financial crisis in 2008, and the COVID-19 pandemic in 2020. In these scenarios, the rate cuts were a reaction to impending or ongoing economic weakness, which negatively impacts corporate earnings and investor confidence.
While the recent cuts were primarily driven by cooling inflation, Fed officials have also noted changes in the job market, including a rise in the unemployment rate from 3.7% to 4.1% last year. This raises the question of whether the cuts might also be a pre-emptive move against potential economic softening. Short-term market jitters often stem from this uncertainty – do the cuts signal a healthy return to normal, or are they a warning sign of underlying economic trouble?
What’s Next for the S&P 500?
As of mid-June 2025, the S&P 500 is once again approaching record highs, suggesting investors are digesting the initial cuts and focusing on potentially positive outcomes. The expected two additional rate cuts this year would likely be welcomed by the market, barring unforeseen economic shifts.
However, a sudden acceleration in the predicted pace of cuts could signal deeper concerns about the economy’s health. Historically, keeping rates too high for too long has sometimes preceded recessions (indicated by the shaded areas in the chart below).
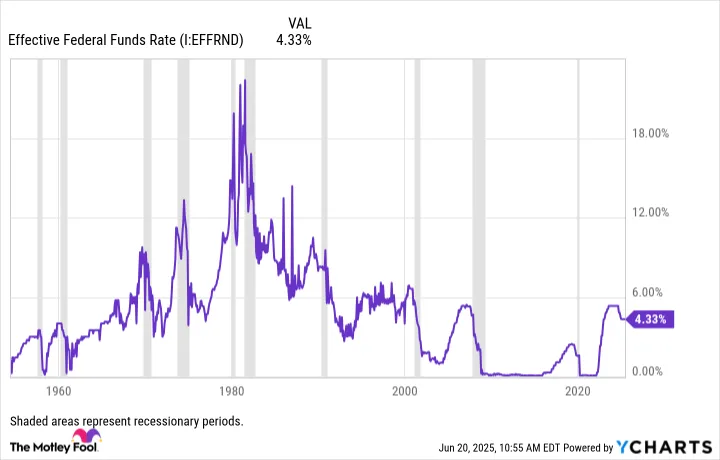 Historical chart comparing the Effective Federal Funds Rate with US recession periods shaded in gray.
While there are currently no strong indicators forecasting an imminent recession, investors should closely monitor economic data, particularly the unemployment rate. A continued significant rise could signal slowing consumer spending and broader economic weakness.
Despite potential short-term volatility, many analysts remain bullish. For instance, Goldman Sachs’ David Kostin recently raised his 12-month S&P 500 target to 6,500, a view shared by Yardeni Research’s Ed Yardeni, who sees 6,500 achievable by the end of 2025.
The Long-Term View Remains Key
Attempting to time the market based on the Fed’s actions is notoriously difficult. While initial rate cuts can coincide with temporary dips due to the underlying economic context, the overall impact of lower rates tends to be supportive of asset prices over time.
History provides a powerful perspective: since its inception in 1957, the S&P 500 has delivered an average annual return of 10.5%, a figure that includes navigating numerous Fed cycles, recessions, and bear markets. Rather than getting caught up in short-term reactions to monetary policy shifts, investors are generally better served by focusing on their long-term financial goals and staying invested.
Watching key economic indicators like unemployment is prudent, but the proven strategy for wealth building in the stock market remains consistent: focus on the big picture and maintain a long-term perspective.