
Dogwifhat (WIF) recently experienced a significant price drop, falling 24% from $1.12 to $0.85, largely mirroring a dip in Bitcoin (BTC). However, WIF is showing early signs of recovery, aligning with a broader slight rebound in the crypto market. This price reset presents a potential re-entry point for interested buyers, though dwindling trading volume raises questions about the strength of any sustained upward move.
Contents
Key Takeaways:
- WIF fell 24% following Bitcoin’s recent dip.
- The price has begun to recover slightly.
- Long-term market structure remains bullish, but short-term momentum is bearish.
- Falling trading volume is a key concern for future price appreciation.
- The dip could be a buying opportunity for traders and investors looking at longer timeframes.
Analyzing WIF’s Chart Signals: Long-Term Bullish, Short-Term Bearish
Looking at the longer-term picture, the 1-day chart for dogwifhat reveals a bullish swing structure. The memecoin successfully broke above its March and April range highs around $0.77 and continues to trade above this level, which now acts as significant support. Both the 20-day and 50-day Moving Averages indicate underlying bullish momentum, with the recent dip finding support near the 50-day MA.
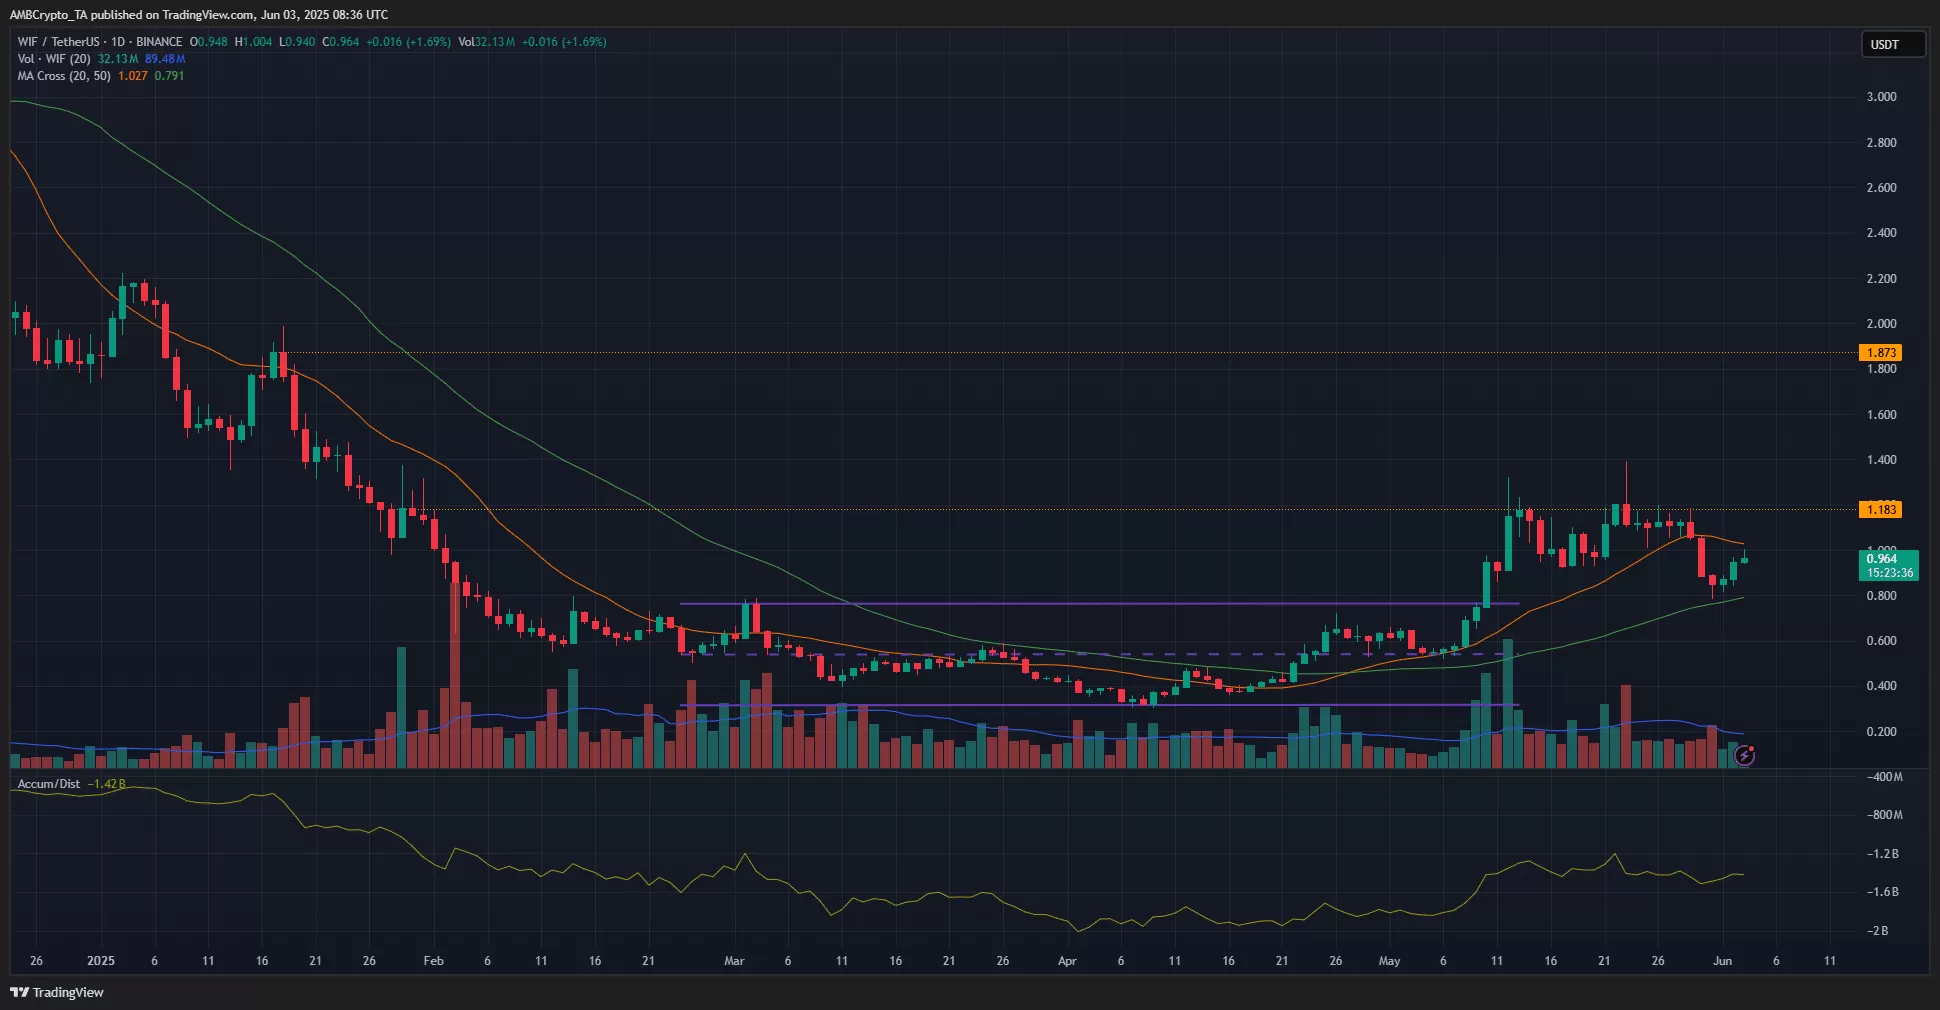 Dogwifhat WIF 1-day price chart showing bullish trend and recent dip near 50-day moving average support
However, a notable concern on this timeframe is the consistent decline in trading volume over the past two weeks. Low volume during a potential recovery can signal a lack of conviction from buyers, potentially leading to a slow, steady price decrease rather than a strong rebound, unless major positive catalysts or a strong BTC rally emerge.
Shifting focus to the shorter 4-hour chart reveals a less optimistic immediate picture. The reduced trading activity coincided with a downward trend in the Accumulation/Distribution (A/D) indicator towards the end of May, suggesting selling pressure outweighed buying. WIF’s price broke below a three-week trading range established between $0.93 and $1.21.
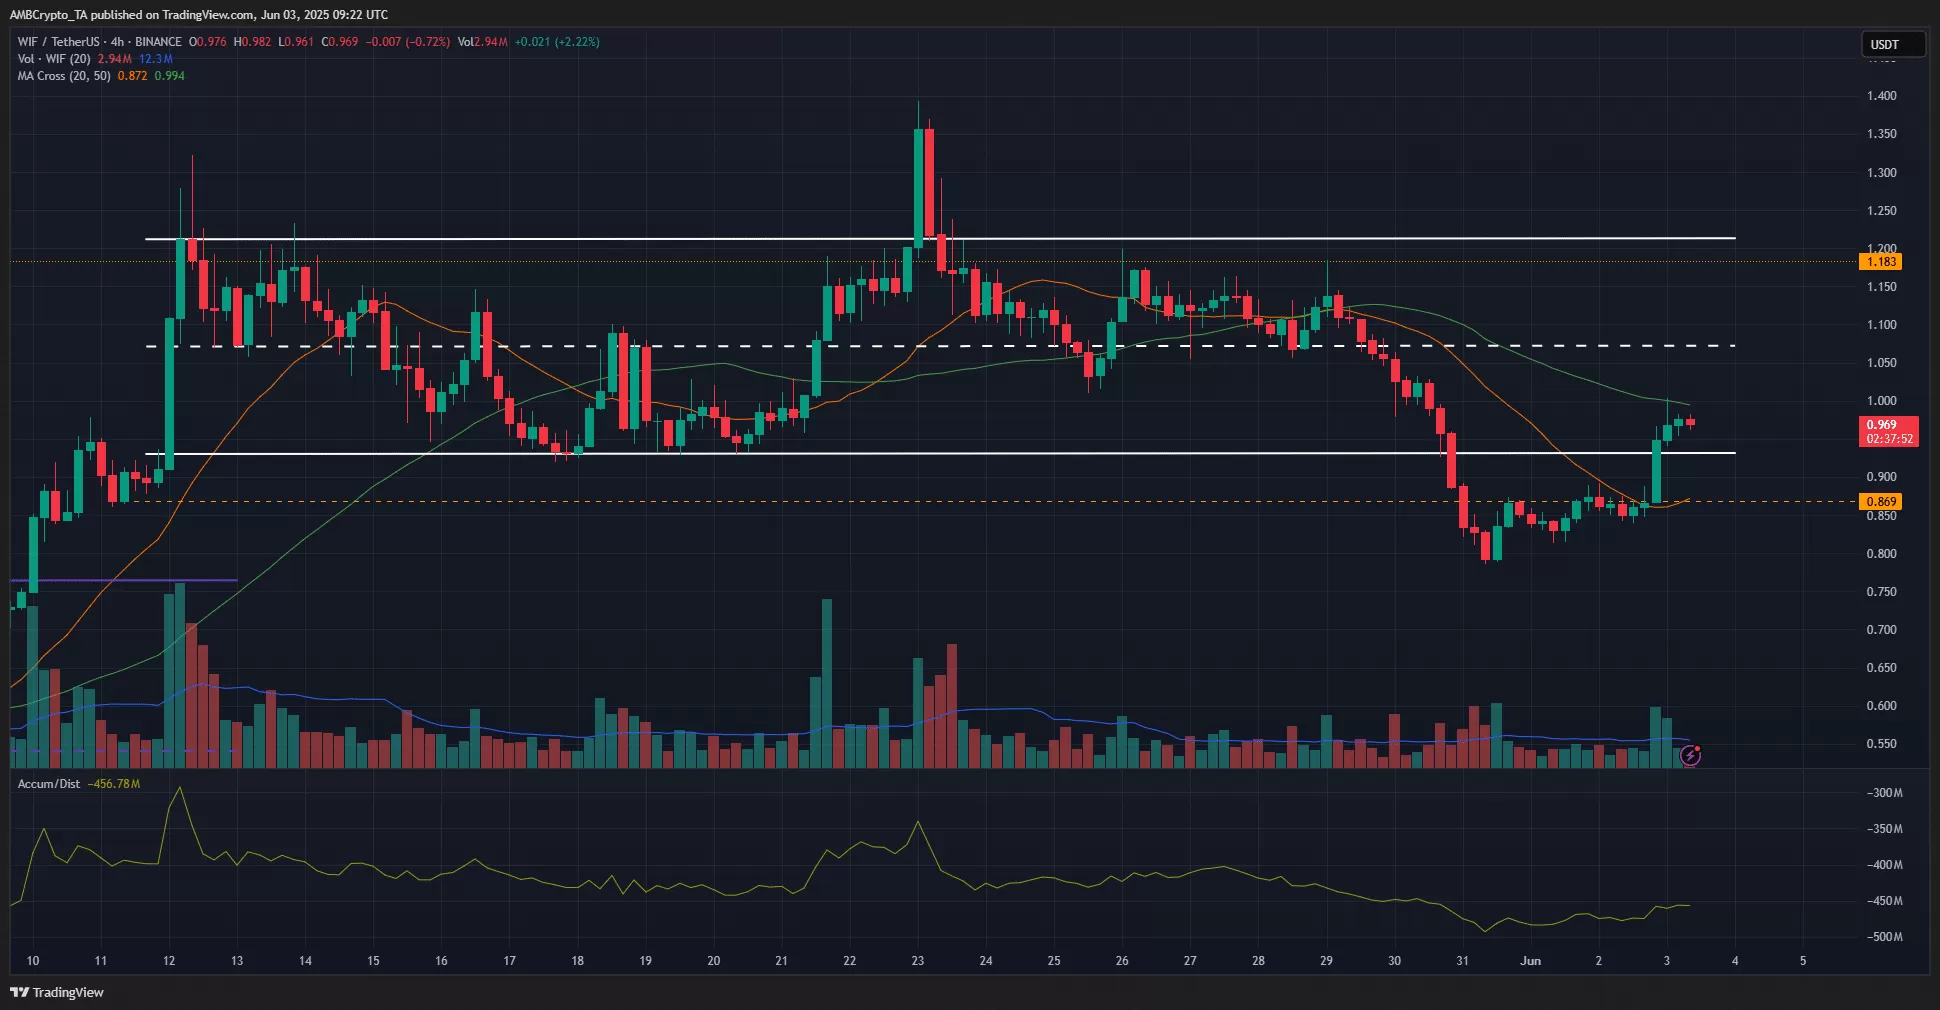 WIF USDT 4-hour price chart showing recent price breakdown from a range and testing a moving average resistance
At present, the Moving Averages on the 4-hour chart signal bearish momentum, with the price currently testing the 50-period MA as potential resistance. Reclaiming this MA would be a crucial first step for WIF to regain bullish traction on this timeframe and target a move back towards the range high of $1.21.
Implications and What’s Next
The recent pullback in dogwifhat can be viewed as a potential buying opportunity for those with a longer-term bullish outlook, aligning with the 1-day chart’s structure. The $0.76 level, just below the previous range high, serves as a logical point for a stop-loss to manage risk on such positions.
However, the lack of significant buying volume and the short-term bearish signals from the 4-hour chart indicate that any recovery might be slow and subject to further volatility. A more severe drop in Bitcoin below $102.8k could easily negate WIF’s attempts at recovery.
For swing traders, a confirmed reclaim of the 50-period MA on the 4-hour chart, potentially accompanied by an increase in volume, would offer a more confident signal for a move towards $1.21. Until then, caution is warranted despite the attractive dip relative to recent highs.
Stay informed on related market movements by exploring articles on memecoins and their performance trends.