
The U.S. housing market continued its gradual shift towards balance in June 2025. Fresh data reveals that the number of homes for sale surged significantly year-over-year, providing welcome relief for buyers navigating limited options. However, the market isn’t uniform, with regional differences and evolving seller behavior presenting a complex picture.
Contents
Here’s a snapshot of the key trends:
- Inventory Growth: Active listings saw their 20th consecutive month of year-over-year gains.
- More Choices: Over 1 million homes were actively listed for the second month in a row.
- Slower Pace: Homes are taking longer to sell compared to last year.
- Seller Adjustments: Price cuts are increasing, and more sellers are choosing to take their homes off the market rather than lower prices.
- Regional Divide: Conditions vary significantly, with the South and West seeing more supply and slower sales than the tighter Northeast and Midwest.
Housing Inventory Continues Upward Trend
June marked the 20th consecutive month of year-over-year growth in active housing inventory. The number of homes for sale increased by a substantial 28.9% compared to June 2024. This momentum brought the total number of actively listed homes to over 1 million (1.08 million) for the second month running, a key milestone surpassing 2020 levels. While still 12.9% below the typical inventory seen from 2017-2019, the gap is narrowing at an accelerating pace.
 Chart showing the year-over-year percentage change in active housing listings in the US, showing consistent growth through June 2025
Total unsold homes, which include properties under contract, also rose, showing a 20% increase from last year, extending a 19-month streak of growth.
 Chart illustrating the year-over-year percentage change in total housing listings (active and pending) in the US through June 2025
However, buyer activity appears more restrained. Pending home sales, representing properties under contract, declined by 1.6% year-over-year in June, following similar drops in April and May.
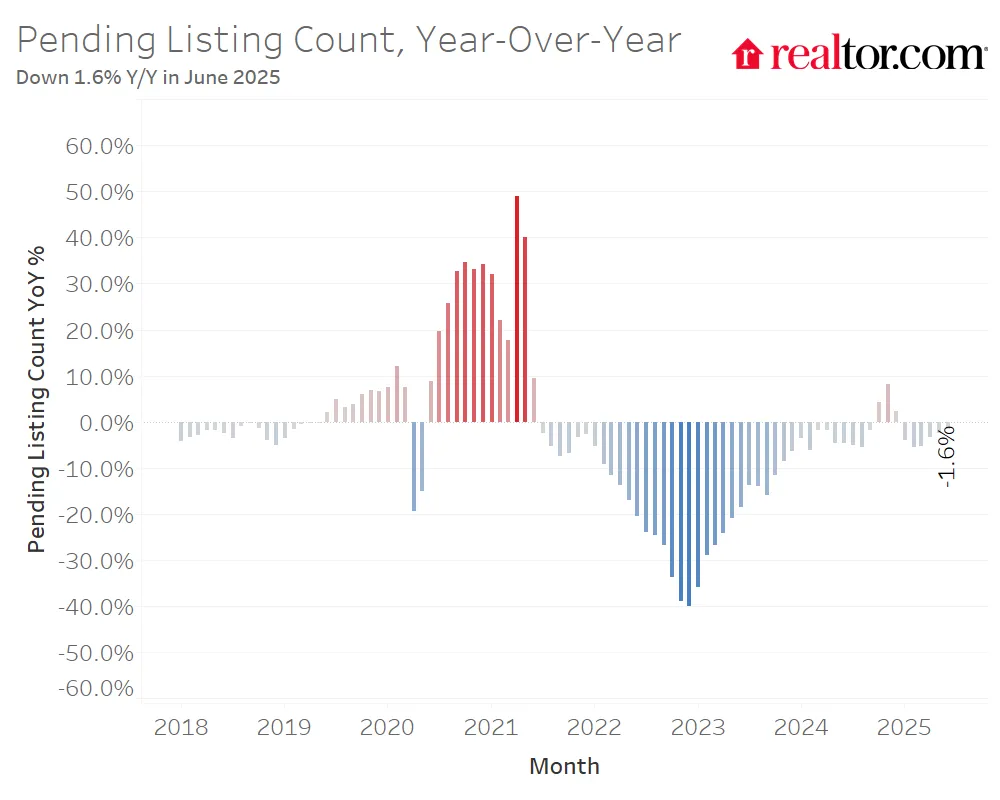 Chart showing the year-over-year percentage change in pending home sales in the US, indicating a recent decline
Newly listed homes saw a modest 6.2% increase compared to June 2024, but this pace has slowed from earlier in the spring. New listings declined for the second straight month, indicating that the typical spring selling surge was unusually muted this year. This suggests some potential sellers might be pulling back from entering the market.
 Chart displaying the year-over-year percentage change in new housing listings entering the market in the US
Where Inventory is Growing
All major U.S. regions saw inventory increases in June:
- West: +38.3%
- South: +29.4%
- Midwest: +21.3%
- Northeast: +17.6%
Among the 50 largest metro areas, all recorded year-over-year inventory growth. Markets with the largest increases included Las Vegas (+77.6%), Washington, DC (+63.6%), and Raleigh (+56.4%).
Pandemic Recovery Varies by Region
The recovery of housing inventory to pre-pandemic levels (2017-2019 average) shows a striking regional divide. While the West (+11.4%) and South (+4.7%) have surpassed their pre-pandemic inventory counts, the Midwest (-40.3%) and Northeast (-51.4%) still face significant supply deficits. This pattern is linked to post-pandemic construction trends and existing housing supply gaps.
Most major metros in the South and West now exceed their pre-pandemic inventory levels, whereas all major Northeast and Midwest metros remain below. Markets showing the greatest inventory levels relative to their pre-pandemic norms include Denver (+88.1%), Austin (+69.7%), and San Antonio (+59.7%). Conversely, metros like Hartford, CT (-75.9%), Chicago (-59.1%), and Virginia Beach, VA (-54.5%) lag furthest behind.
Time on Market Edges Up
The typical home spent 53 days on the market in June, five days longer than a year ago. This marks the 15th consecutive month homes have taken longer to sell compared to the previous year. The median time on market has effectively returned to its pre-pandemic average for June (2017-2019).
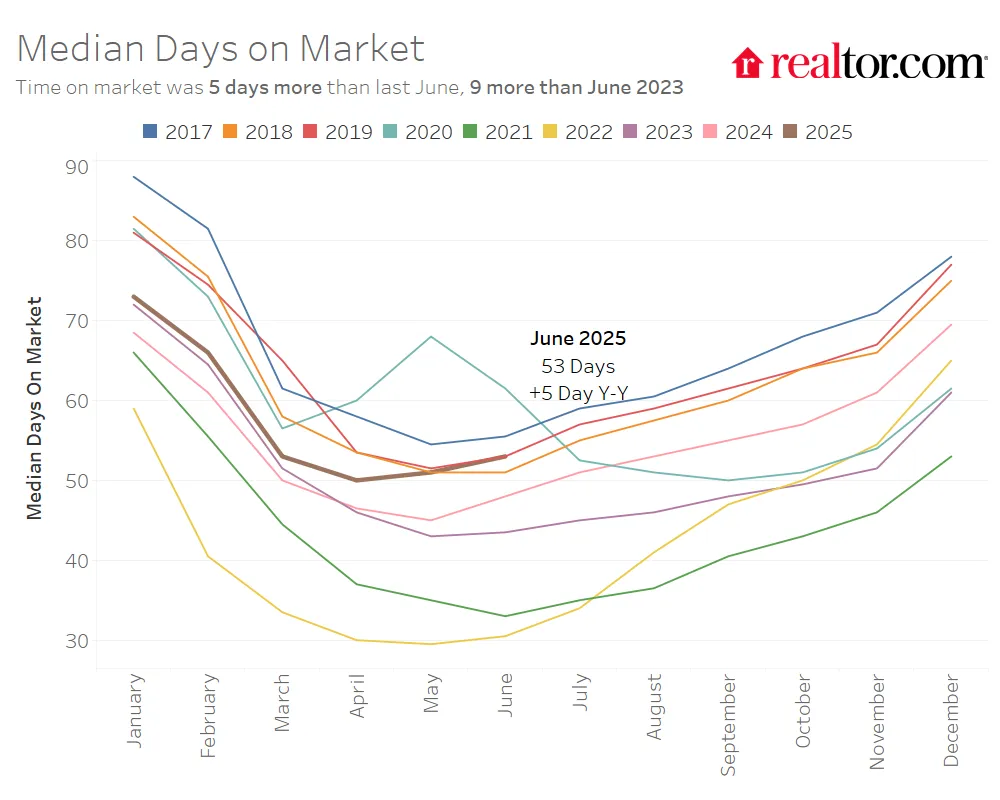 Chart showing the median number of days homes spent on the market in the US, trending upward since 2022
All four major regions saw homes take longer to sell year-over-year, reflecting broader cooling trends:
- South: +8 days
- West: +7 days
- Northeast: +3 days
- Midwest: +1 day
Relative to pre-pandemic norms, only the West (+8 days) is seeing significantly slower sales times. The Midwest (-8 days faster) and Northeast (-11 days faster) remain relatively quick compared to historical averages.
Among the top 50 metros, 39 saw homes linger longer than last year. The biggest slowdowns were observed in Nashville (+20 days), Orlando (+15 days), and Miami (+15 days). Over half of the top 50 markets now see homes take longer to sell than their pre-pandemic averages, predominantly in the South and West, highlighting the continued geographic split in market conditions.
How Sellers Are Responding to a Softer Market
With increasing inventory and slower sales, the housing market is clearly becoming more buyer-friendly. However, this shift comes after a prolonged period dominated by sellers. Many homeowners find themselves in unfamiliar territory where pricing power isn’t guaranteed.
Despite softer demand, the national median list price has remained remarkably flat since spring 2022, hovering around the $440,000 mark in June for the past four years. This suggests many sellers are still setting prices based on peak market expectations. In June, the national median list price was $440,950, up a mere 0.2% year-over-year. Price per square foot, a metric accounting for changing home sizes, saw a slightly larger increase of 0.7%.
 Chart illustrating the trend of the national median housing list price in the US, showing relative stability since 2022
Regional list price trends show slight variations:
- Northeast: +1.8%
- South: 0.0%
- West: -0.8%
- Midwest: -0.9%
When looking at price per square foot, the Northeast shows stronger price growth (+4.0%), while the South saw a slight decrease (-0.3%). Metros experiencing the largest year-over-year median price increases included Baltimore (+7%) and Virginia Beach (+5.2%), while Cincinnati (-6.3%) and Sacramento (-4.8%) saw the biggest declines.
Price Reductions Are Rising
While overall asking prices are mostly flat nationally, sellers are increasingly resorting to price cuts. In June, 20.7% of listings had price reductions, up 2.3 percentage points from a year ago. This is the highest share for any June in available data going back to 2016, and the sixth consecutive month showing growth in price reductions.
 Chart showing the percentage of housing listings with price reductions in the US over time, indicating an increase in 2025
This trend reflects weaker buyer demand due to affordability challenges and increased competition among sellers as inventory grows. Price reductions are significantly more common in the South and West (23% of listings) compared to the Northeast (13%), mirroring regional inventory differences. Metros with the highest share of price cuts included Denver (33.7%), Phoenix (33.2%), and Austin (32.7%).
Delistings on the Rise: Sellers Choose to Wait
Instead of significantly dropping prices, many sellers with strong home equity are opting to remove their listings from the market if they don’t receive acceptable offers. This surge in “delistings” has outpaced inventory growth. Year to date through May, delistings were up 35% compared to last year, and 47% year-over-year for May itself. Active listings, in contrast, grew by 28.4% year to date through May and 31.5% year over year.
 Chart showing the monthly trend of housing delistings in the US, highlighting increased activity in 2025
The ratio of delistings to new listings is also higher this spring than in recent years. Over the past three months, approximately 13 homes were taken off the market for every 100 new homes listed, higher than the 10 per 100 seen in spring 2024 and 2023. This suggests that while more homes are being listed, more sellers are also becoming discouraged and deciding to wait for potentially better conditions. Metros with the highest ratio of delistings to new listings in May included Phoenix (30 per 100) and Miami (27 per 100).
This trend of increased delistings could partially explain why national median list prices remain stable despite softer demand. Sellers with equity can afford to wait, potentially tempering the number of completed sales but also preventing widespread price declines.
Looking Ahead
June’s housing data confirms the market is rebalancing, offering buyers more selection than in recent years. The continued growth in inventory and longer time homes spend on the market point to less frantic conditions. However, the significant regional disparities persist, and seller behavior—particularly the rise in price cuts and delistings—will be a key factor to watch. While the market is shifting, many sellers are resisting major price drops, which could influence how quickly inventory continues to grow and how prices evolve in the latter half of 2025.
For more detailed metro and regional data, explore the full Realtor.com June 2025 Housing Report.