
XRP is at a critical point, showing conflicting signals between potential recovery and further price declines, fueled by a drastic drop in a key on-chain metric. Recent data reveals XRP’s payment volume plummeted by a staggering 90% in just one day, raising questions about network activity and demand. This sudden contraction is a major red flag that market participants should not ignore.
Contents
Key Takeaways:
- XRP’s payment volume dropped from over 1 billion to around 114 million in one day.
- This suggests a potential slowdown in institutional or large-scale usage.
- Despite the volume drop, XRP’s price is technically holding near key support levels like the 200 EMA.
- The price faces significant resistance overhead, failing to capitalize on recent technical patterns.
- The confluence of weak fundamentals (volume) and uncertain technicals creates a high-stakes scenario.
Massive 90% Plunge in XRP Payment Volume
According to recent Highcharts data, one of the most alarming developments for XRP is the dramatic decline in its payment volume. Between June 7 and June 8, the transaction volume on the XRP ledger fell from over 1 billion XRP to approximately 114 million XRP. This represents a nearly 90% decrease in just 24 hours.
This sudden contraction in activity is significant because payment volume is often seen as a proxy for the actual utility and adoption of the XRP network, particularly for large transfers or potential institutional use cases. A decline of this magnitude could indicate a sharp reduction in large-scale transfers or waning interest from major network participants.
Technical Picture Offers Faint Hope, But Lacks Conviction
From a technical price perspective, XRP has not yet experienced a full collapse despite the fundamental volume warning. The price is currently trading just above the 200 Exponential Moving Average (EMA), which has historically acted as a dynamic support level. A recent bounce from this line saw XRP’s price briefly increase by about 3.25%, reaching around $2.20.
However, this modest rebound lacks conviction. The price remains trapped between important resistance levels at $2.26 and $2.55. While XRP recently broke out of a descending triangle pattern – a move typically signaling bullish continuation – its failure to maintain momentum and hold above other key moving averages like the 50 and 100 EMAs casts doubt on the strength of this reversal.
Volume indicators on the price chart confirm this lack of bullish follow-through, suggesting limited buying pressure and decreased price volatility following the breakout attempt.
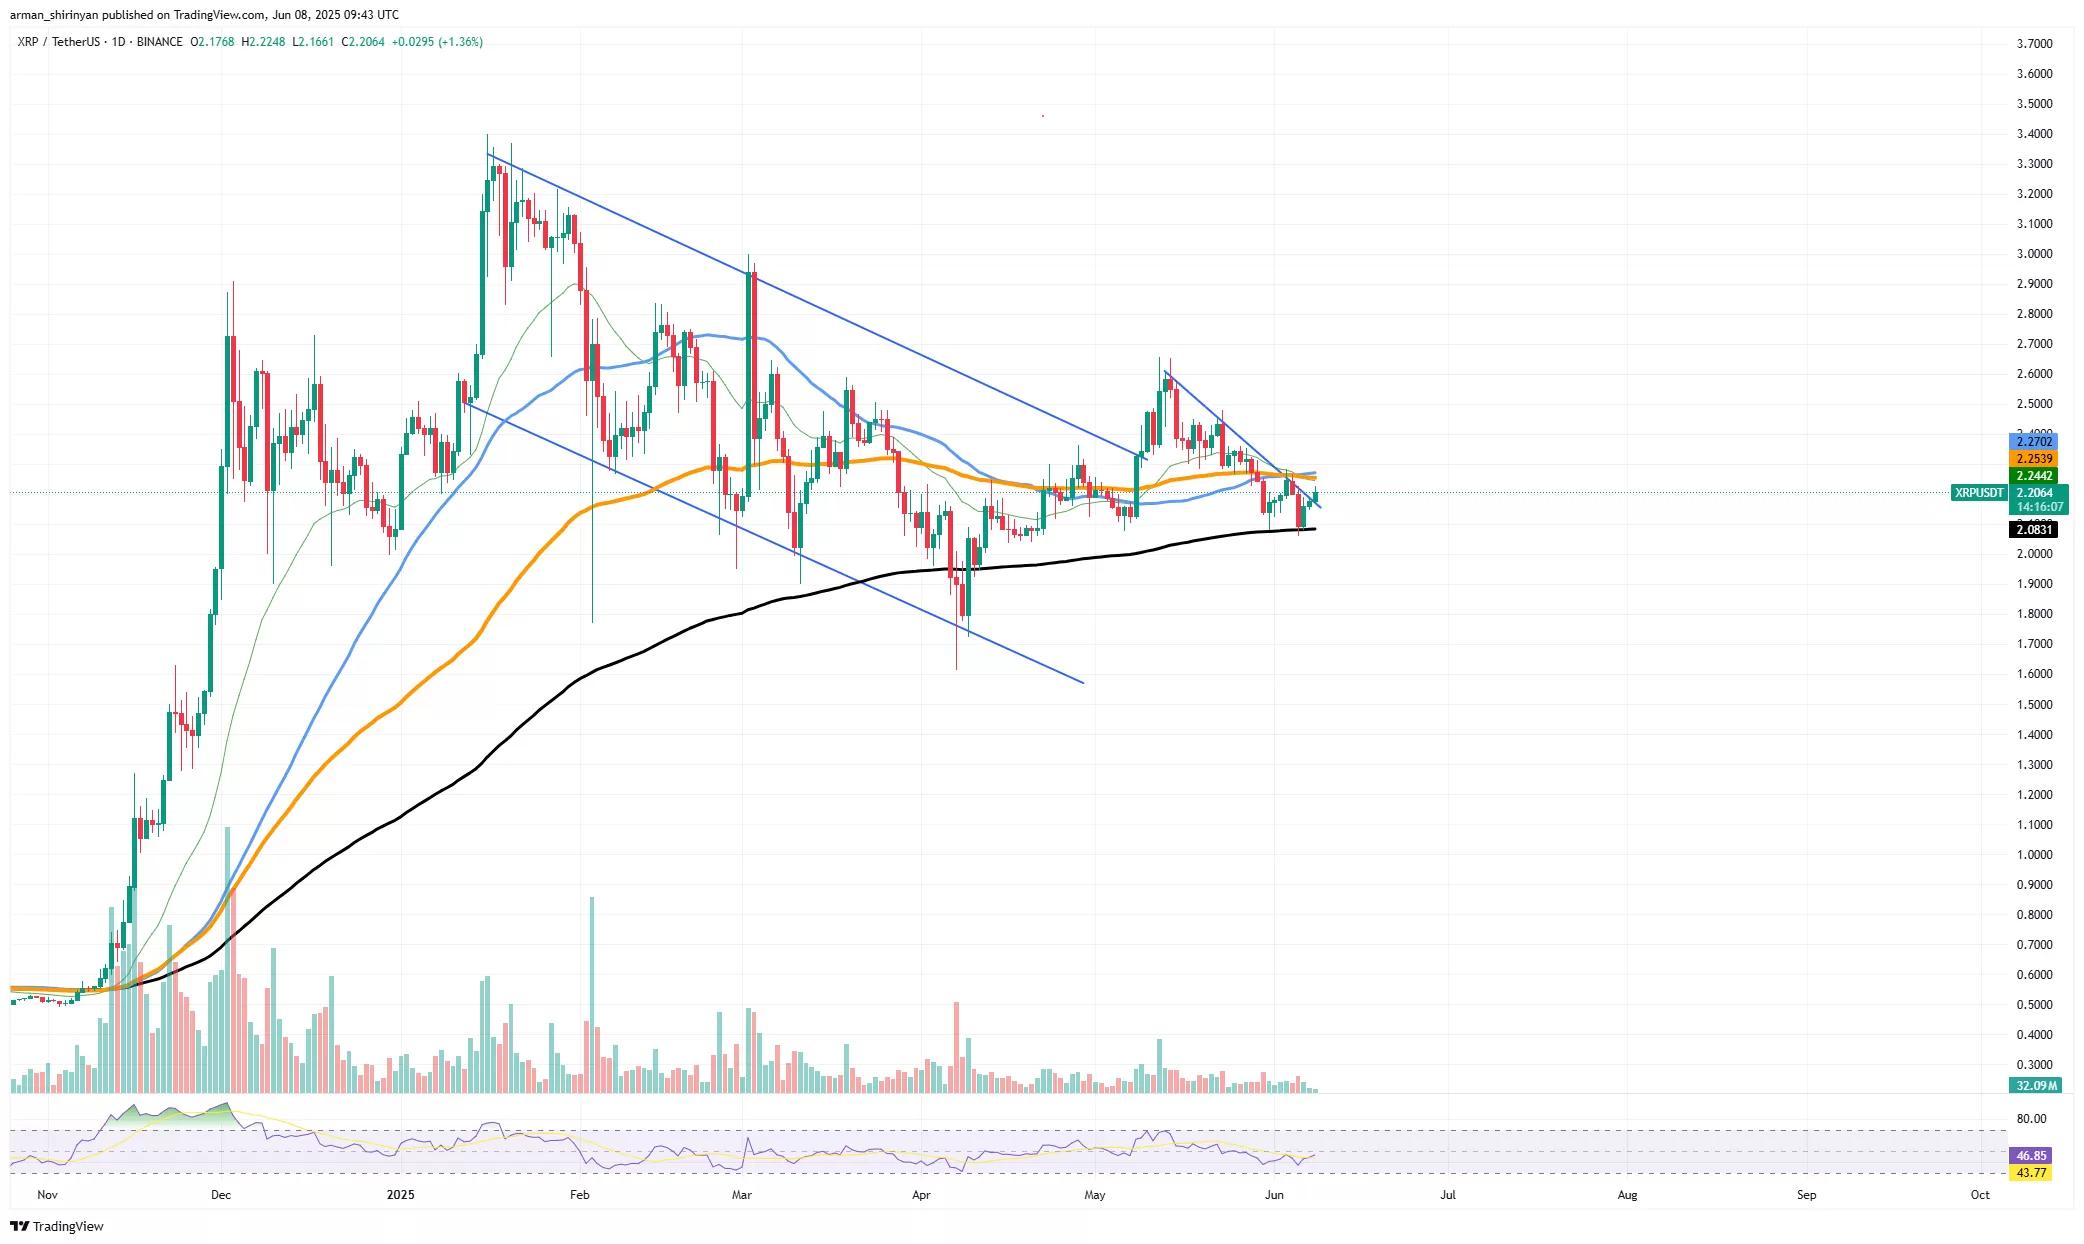 XRP/USDT price chart showing recent movement near key support and resistance levels
What the Volume Drop Means for XRP’s Fundamentals
The sharp decline in payment volume directly undermines the narrative of strong fundamental support for XRP. High payment volume is often cited as evidence of the network’s use case in facilitating fast, low-cost international payments or value transfers. When this metric drops so precipitously, it suggests that this core utility might not be translating into consistent, high-volume activity at present.
Historically, such abrupt contractions in payment volume have preceded periods of price consolidation or even deeper price retracements for XRP. This correlation highlights the importance of network activity metrics in validating the underlying strength or weakness of the asset.
Potential Price Scenarios and Key Levels to Watch
Given the current technical setup and the concerning volume data, XRP’s price faces significant risk if it fails to hold its ground.
The 200 EMA, currently positioned just above the $2.08 level, is the immediate critical support. If XRP breaks convincingly below the 200 EMA, the price could potentially drop towards the psychological support level at $2.00. A continued breakdown could see it test lower levels, potentially targeting $1.80.
However, it’s also important to consider that large, sudden drops in on-chain metrics can sometimes be temporary fluctuations caused by specific institutional users or large holders (whales) pausing their operations. If the broader market sentiment remains stable or improves, and if XRP can manage to rebound strongly back above the $2.20 level, making another attempt to break through the $2.55 resistance with increased volume, the current weakness might just be a temporary shakeout before a potential move higher.
For related insights into Ripple’s activity, explore recent reports on Ripple’s $487M XRP Transfer Sparks Questions.
The Bottom Line: Balancing Act on a Thin Line
XRP is undeniably navigating a precarious path right now. The dramatic decline in payment volume presents a significant bearish signal from a fundamental perspective, suggesting potential weakness in network utility or demand. Meanwhile, the price is technically holding near key support but lacks the momentum to break critical resistance levels.
The immediate future for XRP likely hinges on two key factors: the behavior around the 200 EMA support level and whether payment volume recovers. These metrics will determine if the current situation acts as a launchpad for a recovery or a trapdoor leading to further price declines. Investors should closely monitor these indicators for actionable insights into XRP’s next major move.
To stay informed on broader market dynamics and XRP’s position, consider reading analyses on topics like BlackRock Could File for XRP ETF: What Could It Mean For Approval Odds?.