
The Indian stock market, represented by the Nifty 50 index, closed flat on July 7 after a session marked by low trading volumes and indecision. Market participants are closely watching technical levels, derivatives data, and external factors like potential India-US trade developments to gauge the direction for July 8 trading.
Contents
Key Takeaways:
- Nifty 50 shows signs of indecision but holds key support, with technical indicators suggesting fading momentum despite positive crossovers.
- Bank Nifty also saw a subdued session, with technical signals showing some caution for bulls.
- Crucial support and resistance levels are identified based on pivot points and options data for both indices.
- Derivatives data indicates mixed signals, with rising Put-Call Ratio pointing to potentially firming bullish sentiment while some F&O stocks show short build-up.
Market Movements and Key Levels
On July 7, the Nifty 50 index traded within a narrow 80-point range, managing to stay above its immediate support zone of 25,300–25,350. This continued its pattern of forming higher highs and higher lows. However, the flat closing and low volume indicate a lack of strong directional conviction among traders.
According to market experts, a decisive break below the 25,300 level could see the Nifty testing lower supports around 25,200 and 25,100. Conversely, a move above 25,500 on the upside could potentially push the index towards the 25,650–25,700 range.
For traders looking at technical support and resistance, pivot points for the Nifty 50 (trading at 25,461) are identified at:
- Resistance: 25,484, 25,504, 25,535
- Support: 25,421, 25,402, 25,370
Technical Formations and Indicators
The Nifty 50 daily chart formed a Doji-like candlestick pattern, signaling equilibrium between buyers and sellers. Despite trading above short-term moving averages, momentum indicators offer a mixed picture. The Relative Strength Index (RSI) at 61.02 maintains a positive crossover, suggesting underlying strength, but the Moving Average Convergence Divergence (MACD) histogram indicates that upward momentum might be fading.
 Technical chart showing Nifty 50 daily candlestick pattern and indicators
The Bank Nifty index also experienced a lackluster session with low volumes, closing at 56,949. It formed a Doji-like pattern on its daily chart and remained above short-term moving averages and the Bollinger Bands midline.
However, technical indicators for Bank Nifty suggest caution. The MACD shows a negative crossover with a subdued histogram, while the RSI at 57.93 and Stochastic RSI also maintain a negative crossover.
Key pivot levels for Bank Nifty are:
- Resistance: 57,100, 57,174, 57,294
- Support: 56,860, 56,786, 56,666
Fibonacci retracement levels provide additional potential resistance at 57,566 and 58,224, and support at 56,389.
Understanding Derivatives Data
Analyzing the derivatives market, specifically options data, provides insights into where traders anticipate support and resistance levels to be strong.
Nifty Options Data
According to weekly options data, the 26,000 strike price for Call options holds the maximum Open Interest (OI), indicating it could act as a significant resistance level for the Nifty in the short term. Other notable Call OI concentrations are at the 25,500 and 25,600 strikes.
Maximum Call writing (fresh short positions) was observed at the 25,600, 26,000, and 25,500 strikes, reinforcing these as potential resistance areas. Conversely, Call unwinding (closing of short positions) was seen at the 25,700, 25,350, and 25,300 strikes.
On the Put side, the 25,000 strike shows the highest Put OI, suggesting it could serve as a crucial support level for the Nifty. High Put OI is also seen at the 25,300 and 25,400 strikes.
Maximum Put writing (fresh long positions) was concentrated at the 25,300, 25,400, and 24,800 strikes, indicating conviction around these support levels. Put unwinding (closing of long positions) occurred at the 25,200, 25,100, and 25,600 strikes.
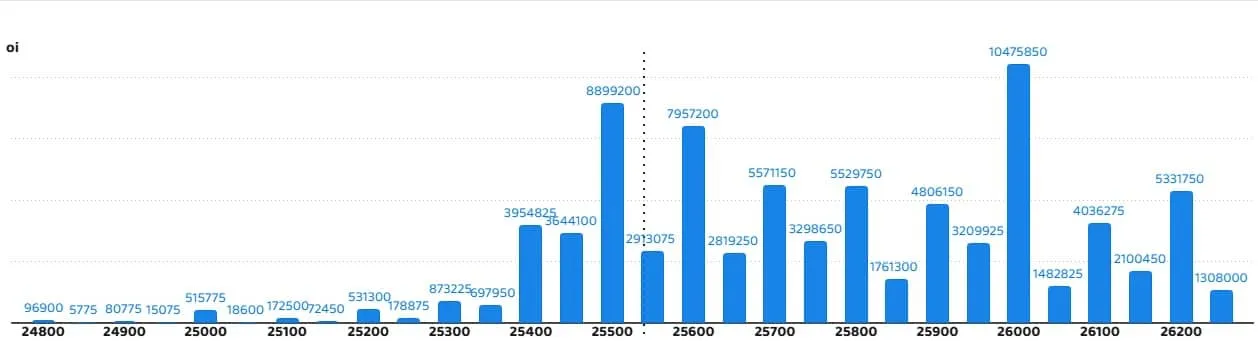 Chart showing Nifty weekly options Open Interest data for July 7, 2025
Bank Nifty Options Data
Monthly options data for Bank Nifty shows maximum Call OI at the 56,000 strike, followed by 57,000 and 57,500, suggesting these could act as resistance levels.
Maximum Call writing for Bank Nifty was concentrated at the 57,000, 57,500, and 58,000 strikes. Call unwinding was noted at 58,800, 56,800, and 58,900.
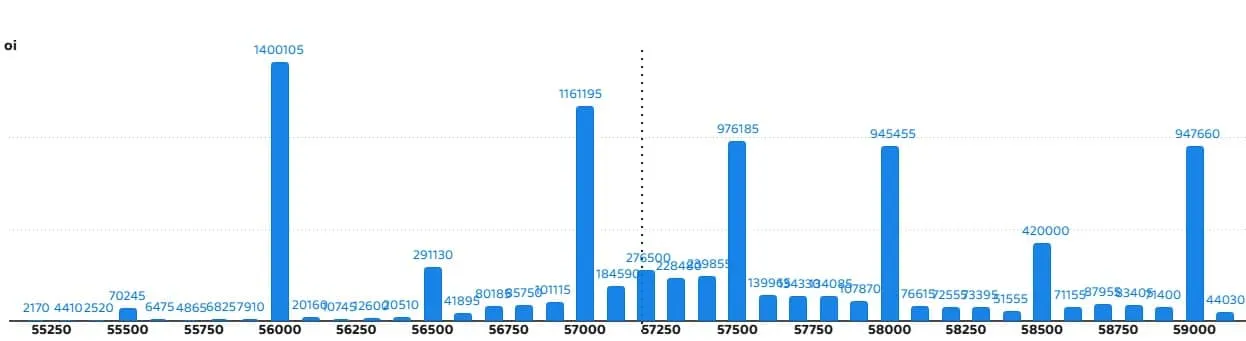 Chart showing Bank Nifty monthly options Open Interest data for July 7, 2025
For Put options on Bank Nifty, the 56,000 strike holds the maximum OI, positioning it as a key support level. High Put OI is also seen at 57,000 and 56,500.
Maximum Put writing occurred at the 56,500, 57,200, and 55,900 strikes. Put unwinding was significant at 56,800, 57,500, and 57,100.
Broader Market Indicators
Several other indicators provide a broader view of market sentiment and potential volatility.
Funds Flow
Analysis of fund flows (both Foreign Institutional Investors – FIIs and Domestic Institutional Investors – DIIs) is crucial for understanding institutional activity which often drives market trends. While the specific data isn’t detailed here, tracking FII and DII activity can indicate net buying or selling pressure on the market.
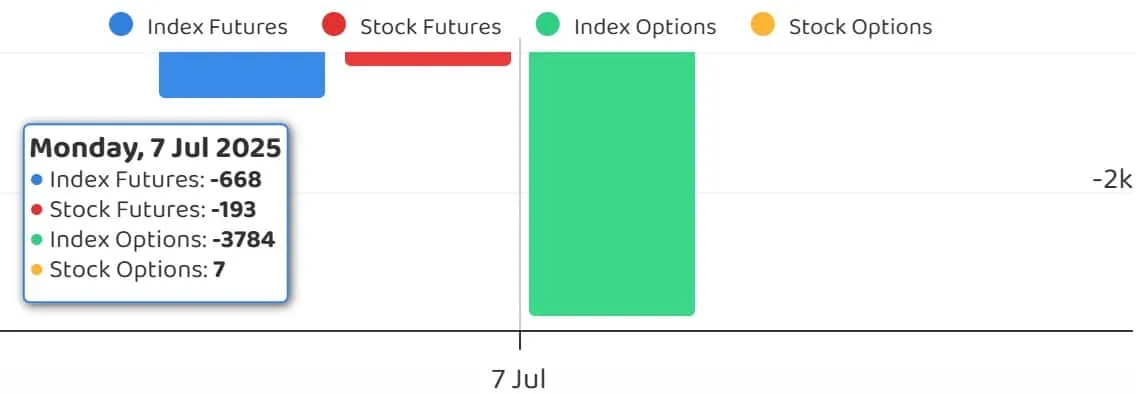 Chart showing Funds Flow data (FII and DII activity) for July 7, 2025
Put-Call Ratio (PCR)
The Nifty Put-Call ratio (PCR), which measures the total Put options OI divided by total Call options OI, serves as a sentiment indicator. A PCR above 1 generally suggests a bullish bias, while below 1 indicates a bearish bias. The PCR rising from 0.93 to 0.95 on July 7 suggests a marginal increase in bullish sentiment or hedging activity leaning slightly bullish. A ratio above 0.7 or moving towards 1 is often seen as indicative of potential firming up of bullish sentiment as traders sell more Puts.
India VIX
The India VIX index, often called the ‘fear gauge,’ measures market expectations of volatility. A lower VIX typically suggests less uncertainty and can be supportive for bulls, while a rising VIX indicates increasing fear and potential for sharp market swings. On July 7, the India VIX rose slightly to 12.56 after a four-day decline, but it remains in relatively lower zones, which continues to be favorable for bullish market conditions.
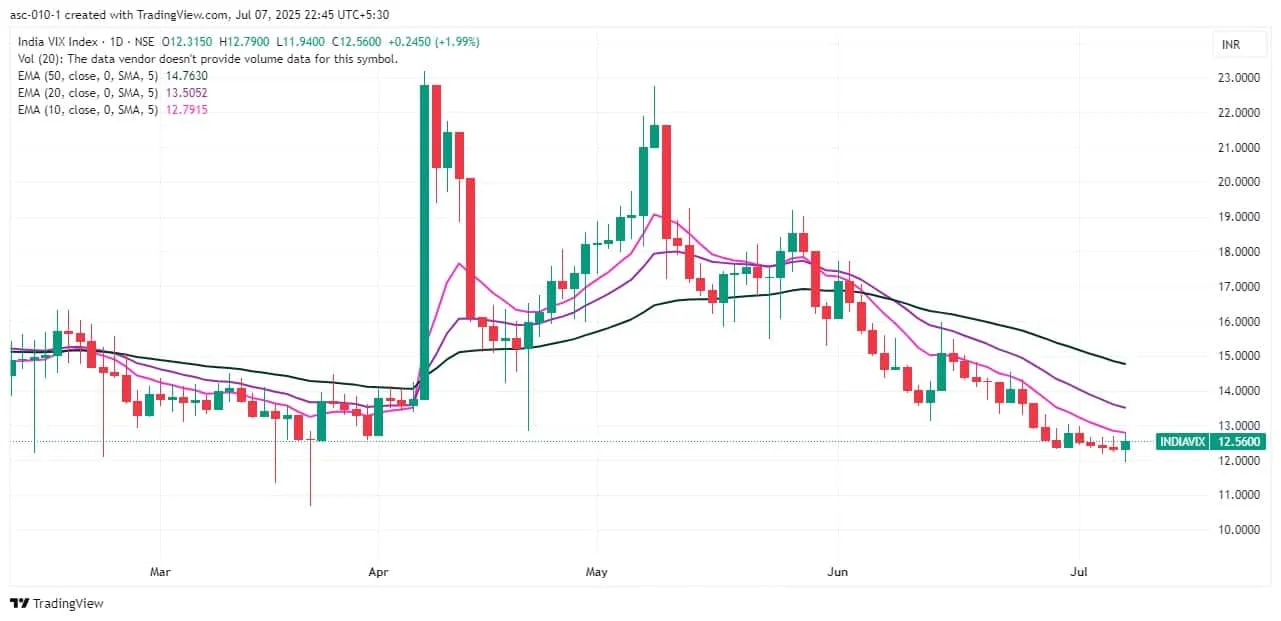 Chart showing India VIX movement for July 7, 2025
Stock-Specific Activity in F&O
Looking beyond the indices, futures and options data for individual stocks provide insights into where traders are building positions.
- Long Build-up: An increase in both price and Open Interest in a stock’s F&O contract indicates that traders are initiating fresh long (buy) positions, expecting the price to rise further. 40 stocks showed long build-up on July 7.
- Long Unwinding: A decrease in OI accompanied by a fall in price suggests traders are closing their long positions. 56 stocks saw long unwinding.
- Short Build-up: An increase in OI along with a fall in price signals traders are initiating fresh short (sell) positions, anticipating a price drop. 85 stocks exhibited short build-up.
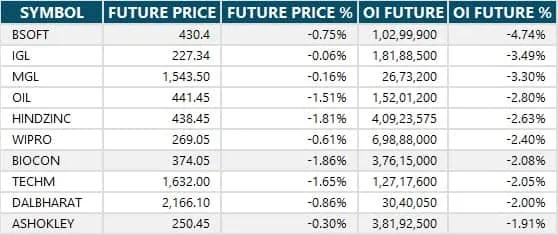 Chart showing stocks with Long Unwinding activity in F&O for July 7, 2025
- Short Covering: A decrease in OI coupled with an increase in price suggests traders are closing their short positions, often fueling a price rally. 47 stocks saw short covering.
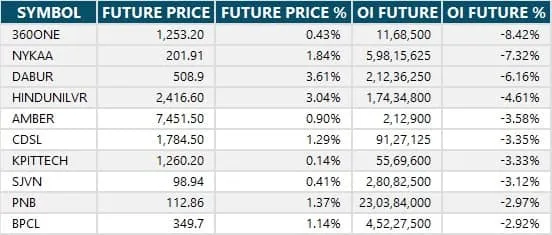 Chart showing stocks with Short Covering activity in F&O for July 7, 2025
Additionally, tracking stocks with high delivery trades indicates strong investor interest (as opposed to short-term trading), while monitoring the list of stocks under the F&O ban (due to high open interest crossing market-wide limits) is important as no new positions can be taken in these securities. As of the update, RBL Bank remained on the F&O ban list.
Outlook for July 8
The market outlook for July 8 appears poised for movement based on whether key support or resistance levels are broken. The indecisive technical patterns suggest that while the underlying trend remains positive (Nifty’s higher highs/lows, trading above moving averages), momentum might be waning, particularly in Bank Nifty.
Options data points to 25,000-25,300 as crucial support for Nifty and 25,500-26,000 as resistance. For Bank Nifty, 56,000 and 56,500 are key supports, with 57,000 and 57,500 acting as resistances. Institutional flows and global cues, including updates on the potential India-US trade deal, will also play a significant role. Traders should watch for a clear break above or below the immediate range to confirm the next directional move.
For more detailed analysis and market updates, explore related articles on market trends and specific stock performance.