
The Indian stock market, led by the Nifty 50, is facing a critical juncture as bearish sentiment deepens. After two consecutive sessions of decline, the Nifty 50 is testing crucial support levels, while the Bank Nifty also shows signs of weakness. This detailed market analysis for July 21 highlights key trading levels, technical indicators, and options data that traders and investors must watch closely.
Contents
- Nifty 50: Testing Crucial Support Amid Downtrend
- Technical Indicators and Price Action
- Bank Nifty: Pressure Mounts on Key Levels
- Understanding Bank Nifty’s Technical Signals
- Decoding Options Data: Nifty & Bank Nifty Call/Put Analysis
- Nifty 50 Options Outlook
- Bank Nifty Options Outlook
- Market Sentiment & Volatility: PCR and India VIX
- Institutional Investor Activity: Funds Flow Analysis
- Stock-Specific Trends: Long/Short Positions and Delivery
- Long and Short Market Positions
- High Delivery Trades
- F&O Ban List: Impact on Trading
- Conclusion: Navigating a Bearish Market
Key Takeaways:
- Nifty 50 approaches a crucial support at 24,900; a break could lead to 24,700, while resistance is seen at 25,000-25,100.
- Bank Nifty has fallen below its 20-day EMA, indicating bearish bias with key support at 56,207.
- Options data shows significant resistance for Nifty at 25,200 (Call OI) and support at 24,900 (Put OI).
- Put-Call Ratio (PCR) has declined, signaling a bearish mood in the market.
- Institutional flows indicate continued selling by Foreign Institutional Investors (FIIs), adding pressure.
Nifty 50: Testing Crucial Support Amid Downtrend
The Nifty 50 experienced a six-tenths of a percent fall on July 18, marking its second consecutive session of decline. The index tested its medium-term moving average, specifically the 50-day Exponential Moving Average (EMA) at 24,900, on the last trading day of the week. This drop occurred as the index broke below upward-sloping support trendlines, signaling a shift in momentum.
Technical Indicators and Price Action
The Nifty 50’s daily chart shows a bearish candle, continuing a pattern of lower highs and lower lows. It traded near the lower line of the Bollinger Bands, accompanied by above-average trading volumes. This suggests strong selling pressure. The Relative Strength Index (RSI), a momentum indicator, dropped to 43.07, while the Moving Average Convergence Divergence (MACD) histogram weakened further, reinforcing the bearish sentiment.
For the upcoming session, 24,900 remains a pivotal level. If the Nifty 50 breaks and sustains below this mark, a further decline toward the 24,700 support level is likely. Conversely, if it holds above 24,900, the 25,000–25,100 zone will act as key resistance. Based on pivot points, key resistance levels are identified at 25,097, 25,150, and 25,236, while support levels are at 24,924, 24,871, and 24,785. Traders should monitor these levels closely for potential entry or exit points.
 Indian Stock Market Overview
Bank Nifty: Pressure Mounts on Key Levels
The Bank Nifty also experienced a significant decline, opening with a gap-down and decisively falling below its 20-day EMA. The index broke down an upward-sloping support trendline and tested the lower line of the Bollinger Bands. This price action, combined with the formation of a bearish candle featuring a sizeable upper shadow on the daily timeframe, strongly indicates a prevailing bearish bias.
Understanding Bank Nifty’s Technical Signals
Similar to the Nifty, the Bank Nifty’s MACD histogram continued to weaken, and its RSI declined to 45.30, both reinforcing the negative outlook. For traders, key resistance levels based on pivot points are 56,589, 56,707, and 56,898. Fibonacci retracement levels suggest additional resistance at 57,047 and 57,634. On the support side, pivot points indicate levels at 56,207, 56,089, and 55,897, with Fibonacci retracement supporting levels at 56,098 and 55,872. These levels are critical for understanding potential reversals or continuations of the downtrend.
Decoding Options Data: Nifty & Bank Nifty Call/Put Analysis
Analyzing the options data provides insights into market participants’ expectations for future price movements, identifying key support and resistance zones based on open interest (OI).
Nifty 50 Options Outlook
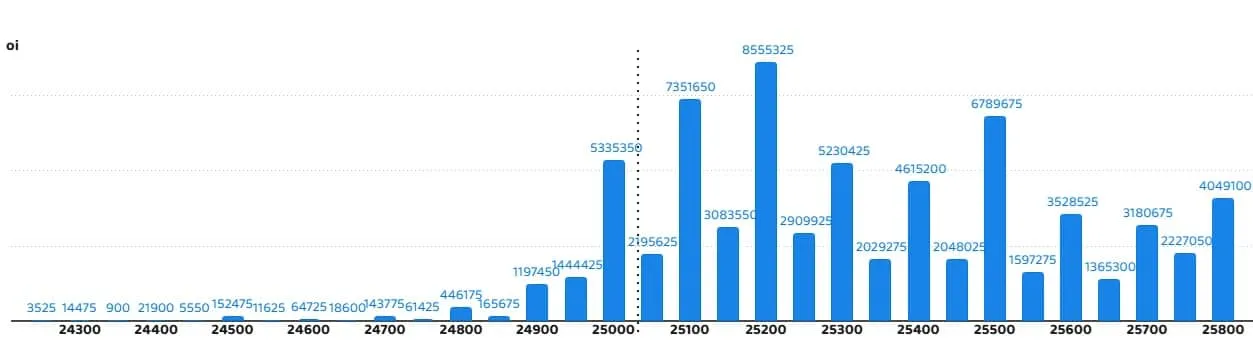
For the Nifty 50, weekly options data reveals maximum Call open interest concentrated at the 25,200 strike price, with 85.55 lakh contracts. This substantial Call OI suggests that 25,200 will act as a strong resistance level in the short term. Other notable Call resistance levels are 25,100 (73.51 lakh contracts) and 25,500 (67.89 lakh contracts).
Maximum Call writing, indicating fresh bearish positions, was observed at the 25,100 strike (54.07 lakh contracts added), followed by the 25,000 and 25,200 strikes. Conversely, minimal Call unwinding (short covering) was seen across the 24,250-25,800 strike band, further confirming the bearish sentiment.
On the Put side, the 24,900 strike holds the maximum Put open interest with 48.6 lakh contracts. This level is expected to serve as a crucial support for the Nifty 50. Other significant Put support levels are 25,000 (46.6 lakh contracts) and 24,500 (41.56 lakh contracts). Max Put writing was observed at 24,900 (15.46 lakh contracts added), indicating traders are betting on this level holding as support. Put unwinding was most prominent at 25,200, suggesting some bearish moves at higher levels.
 Nifty 50 Options Open Interest Analysis
Bank Nifty Options Outlook
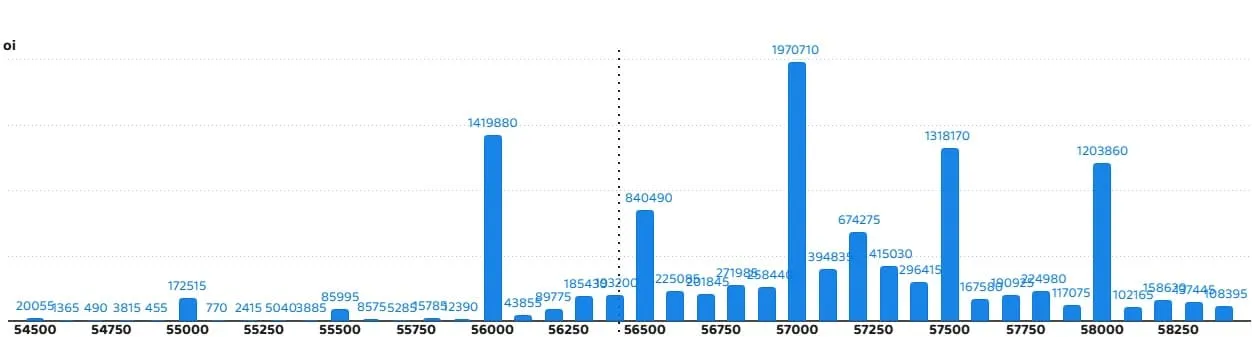
Monthly options data for the Bank Nifty shows the 57,000 strike as the highest Call open interest, with 19.7 lakh contracts, marking it as a significant short-term resistance. The 56,000 and 57,500 strikes also show considerable Call OI. Maximum Call writing was noted at the 56,500 strike, reinforcing its role as a key resistance. Call unwinding was observed at 57,100, 57,700, and 56,900, suggesting some profit-taking or short-covering at these higher levels.
For Bank Nifty Put options, the 56,000 strike holds the maximum Put open interest (22.62 lakh contracts), indicating a strong support level. Other important Put supports are 57,000 and 55,000. Maximum Put writing occurred at the 56,500 strike, followed by 56,400 and 55,500, signaling confidence in these levels as immediate supports. However, significant Put unwinding at 57,000, 56,000, and 56,800 suggests weakness at these price points.
 Bank Nifty Options Open Interest Breakdown
Market Sentiment & Volatility: PCR and India VIX
The Put-Call Ratio (PCR) is a widely used indicator to gauge market sentiment. On July 18, the Nifty PCR declined to 0.78 from 0.94 in the previous session. A PCR value below 0.7, or moving towards 0.5, typically indicates that Call selling is higher than Put selling, reflecting a bearish mood in the market. The recent decline in PCR points towards increasing bearishness.
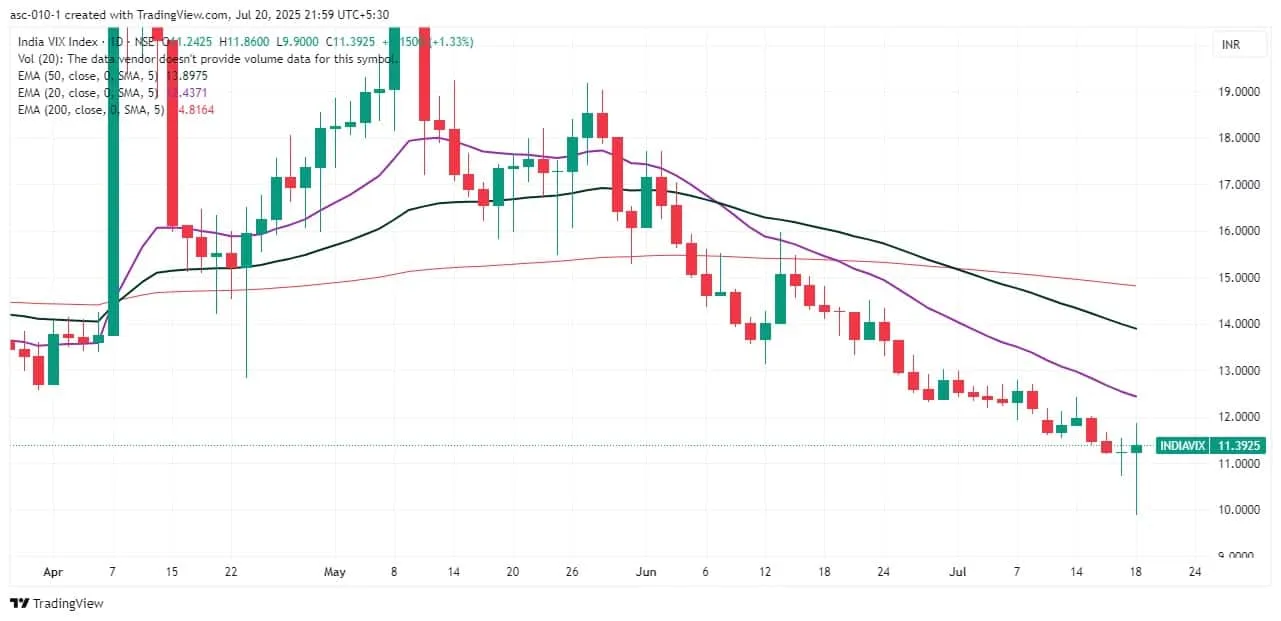
The India VIX, often referred to as the “fear gauge,” rose by 1.33 percent to 11.39 levels. While still in a lower range, suggesting relative stability, its upward movement warrants attention. A rising VIX, even from low levels, can signal increasing market uncertainty and the potential for a major breakout or breakdown. Traders should be alert to this subtle shift in volatility.
 India VIX Volatility Index Chart
Institutional Investor Activity: Funds Flow Analysis
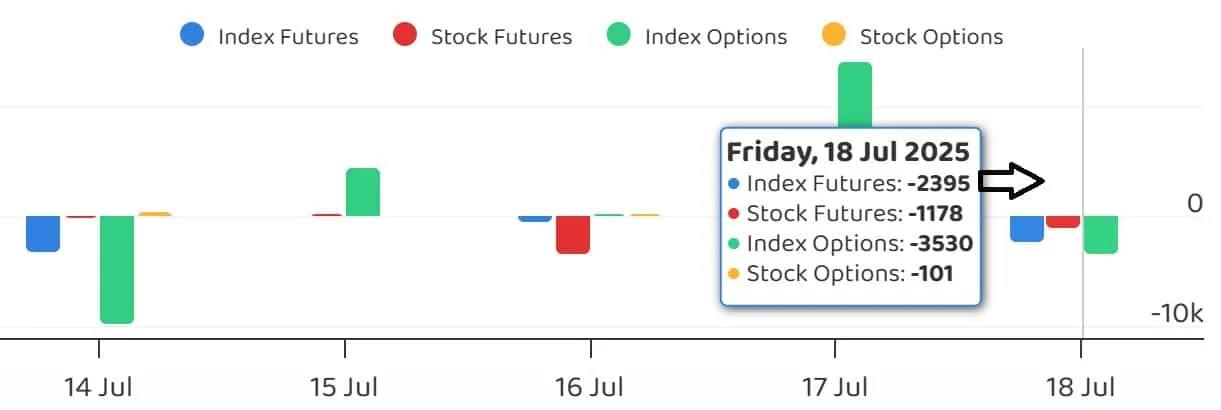
Understanding the flow of funds from Foreign Institutional Investors (FIIs) and Domestic Institutional Investors (DIIs) is crucial for assessing market liquidity and sentiment.
 Foreign and Domestic Institutional Investor Fund Flows India
The latest data on institutional funds flow indicates the overall stance of large players. Continued selling by FIIs, or significant buying by DIIs, can heavily influence market direction. Traders should keep an eye on these trends for broader market implications.
Stock-Specific Trends: Long/Short Positions and Delivery
Beyond the indices, individual stock movements reflect distinct trading and investing interests. Analyzing changes in open interest alongside price movements can highlight which stocks are attracting significant bullish or bearish bets.
Long and Short Market Positions
A ‘long build-up’ signifies an increase in open interest accompanied by a rise in stock price, indicating traders are taking fresh long positions, expecting further price appreciation. Conversely, ‘long unwinding’ involves a decrease in open interest combined with a fall in price, suggesting that existing long positions are being closed out, often due to profit-taking or concerns about future performance. On July 18, 17 stocks saw long build-up, while a significant 88 stocks experienced long unwinding, implying widespread closing of bullish bets.
‘Short build-up’ refers to an increase in open interest with a fall in price, signaling new short positions being initiated, anticipating price declines. A substantial 91 stocks showed short build-up, reflecting a strong bearish sentiment at the individual stock level. ‘Short-covering’ occurs when open interest decreases as the price increases, indicating that previously shorted positions are being closed out, often leading to a temporary price bounce. 31 stocks saw short-covering.
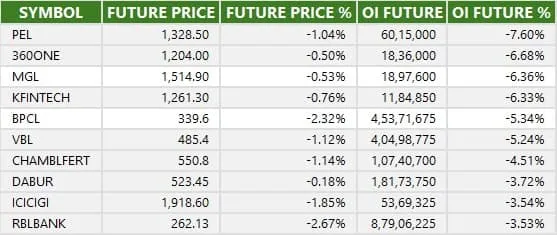 Stock Market Long Unwinding and Short Build-up Trends
High Delivery Trades
Stocks witnessing a high share of delivery trades indicate significant investing interest, as opposed to short-term speculative trading. These are often the stocks where institutional or long-term retail investors are accumulating positions. Monitoring these can provide insights into potential future momentum driven by fundamental outlooks.
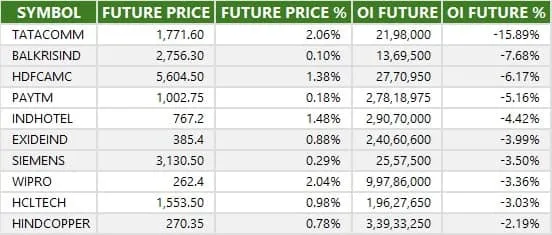 Short Covering and High Delivery Trades in Indian Equities
F&O Ban List: Impact on Trading
Securities are placed under the Futures & Options (F&O) ban when their derivative contracts cross 95 percent of the market-wide position limit. When a stock is under ban, no new F&O positions can be created; only existing positions can be squared off. This can impact liquidity and price discovery for these specific stocks.
For July 21, Bandhan Bank has been added to the F&O ban list. Stocks retained in the ban are Angel One, Hindustan Copper, and RBL Bank. No stocks were removed from the ban. Traders with positions in these stocks must be aware of these restrictions. For more detailed F&O data and market snapshots, you can refer to the Moneycontrol F&O Market Snapshot page.
Conclusion: Navigating a Bearish Market
The overall market outlook for July 21 appears cautious to bearish, driven by the Nifty 50 and Bank Nifty’s continued downtrend and the weakening of key technical indicators. The options data reinforces these signals, pointing to strong resistance levels and declining sentiment. Traders and investors should prioritize risk management and closely monitor the identified critical support and resistance levels. A sustained break below Nifty’s 24,900 mark could accelerate the current downtrend.
For a comprehensive daily update on market-moving data, including detailed pivot points, options chain data, and institutional flows, explore more on Nifty 50 and Bank Nifty analyses.