
The Nifty 50 index showed resilience on July 1st, closing slightly higher after a session marked by profit booking and rangebound trading. The index successfully held above the 25,500 level, suggesting underlying strength despite recent gains. Traders and investors are now looking for clear signals for the July 2nd session. Technical indicators and options data point towards potential consolidation in the short term.
Contents
Here’s a breakdown of key market factors influencing the trade setup for July 2:
Technical Picture: Consolidation Ahead?
After a significant rally, the Nifty 50 appears poised for a phase of consolidation. Experts suggest the 25,650–25,700 zone will likely act as a near-term resistance. A sustained move above this range could signal further upside potential. On the downside, the 25,400–25,300 area is identified as a crucial support zone.
The Nifty’s daily chart shows a Doji candlestick pattern, indicating indecision between buyers and sellers after trading within the previous day’s range. While the index remains above its support trendline and near upper Bollinger Bands, suggesting a positive bias, the fading bullish momentum in the MACD histogram and a negative crossover in the Stochastic RSI hint at possible short-term weakness or sideways movement. The RSI remains positive at 64.29.
The Bank Nifty, in contrast, continues to show bullish strength. It formed a small bullish candle with a long lower shadow on above-average volumes, highlighting buying interest on dips. The index is trading close to its all-time high and the upper Bollinger Bands. The MACD retains a strong positive crossover with increasing momentum. Both RSI (66.51) and Stochastic RSI support the bullish sentiment with positive crossovers.
Nifty 50 Key Levels (25,542):
- Resistance: 25,581, 25,602, 25,637
- Support: 25,511, 25,489, 25,454
Bank Nifty Key Levels (57,459):
- Resistance (Pivot): 57,528, 57,618, 57,765
- Resistance (Fibonacci): 57,566, 58,224
- Support (Pivot): 57,235, 57,144, 56,998
- Support (Fibonacci): 57,032, 56,673
Decoding the Options Data
Options open interest (OI) provides valuable insights into expected support and resistance levels based on where traders are placing their bets.
Nifty Options Data (Weekly):
- Maximum Call OI is concentrated at the 26,000 strike (1.48 crore contracts), making it a significant resistance level. The 25,600 and 25,700 strikes also hold substantial Call OI.
- Significant Call writing was seen at the 26,000, 25,600, and 26,150 strikes, reinforcing these as potential resistance areas.
- Maximum Put OI is highest at the 25,500 strike (1.11 crore contracts), indicating strong support there. The 25,000 and 25,400 strikes also show notable Put OI.
- Maximum Put writing occurred at the 25,500, 25,400, and 24,800 strikes, confirming these as support zones.
 Nifty options data showing Call and Put open interest distribution across strike prices
Bank Nifty Options Data (Monthly):
- Maximum Call OI is at the 56,000 strike (14.19 lakh contracts), acting as a key level, followed by 58,000 and 59,000 strikes.
- Maximum Call writing was observed at the 59,000, 58,000, and 57,500 strikes.
- Maximum Put OI is concentrated at the 56,000 strike (21.18 lakh contracts), serving as a significant support level, followed by 57,000 and 57,500 strikes.
- Maximum Put writing was seen at the 57,500, 57,200, and 57,000 strikes, reinforcing these as potential support levels.
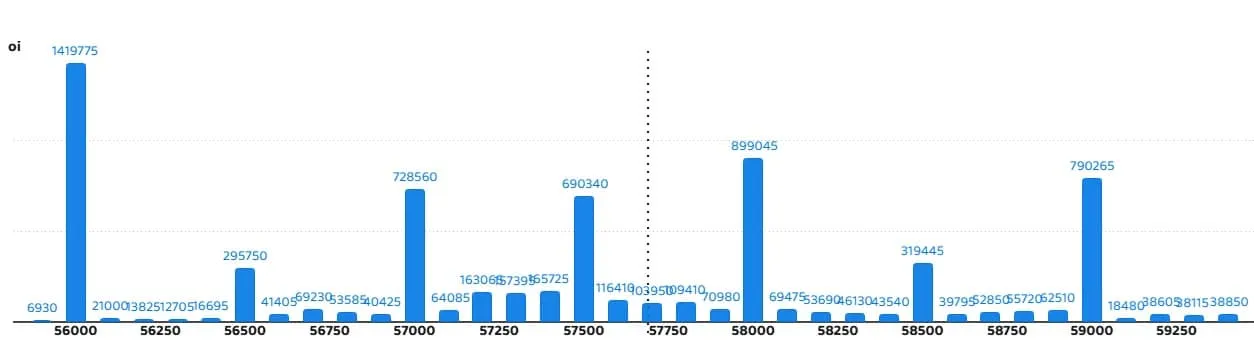 Bank Nifty options data illustrating Call and Put open interest levels
Market Sentiment Indicators
Fund Flows: Tracking how institutional investors (Foreign Institutional Investors – FIIs and Domestic Institutional Investors – DIIs) are trading provides clues about market direction. The funds flow data offers insights into their net buying or selling activity.
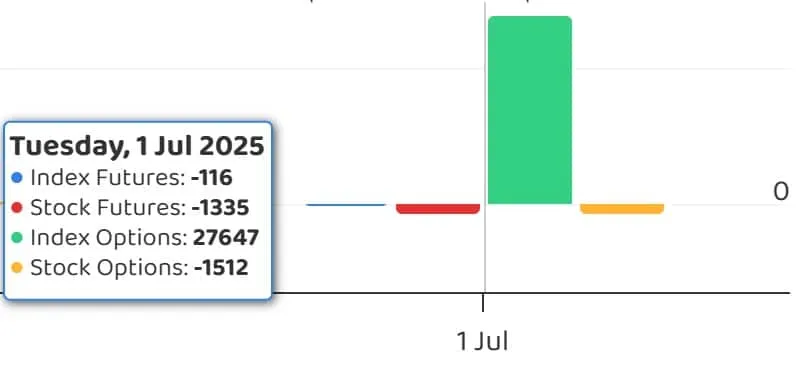 Chart depicting daily Fund Flow data in crore rupees
Put-Call Ratio (PCR): The Nifty PCR increased to 0.88 on July 1st from 0.81 previously. A PCR generally above 0.7 or moving towards 1 suggests more Put selling than Call selling, often indicating a firming up of bullish sentiment. Conversely, a ratio below 0.7 signals more Call selling, suggesting a bearish mood. The current reading leans slightly positive but remains below 1, reflecting the market’s current rangebound tendency.
India VIX: The volatility index, India VIX, dropped by 2.01 percent to 12.53. A lower VIX level typically indicates reduced market volatility and can be seen as a comfort zone for bullish market participants.
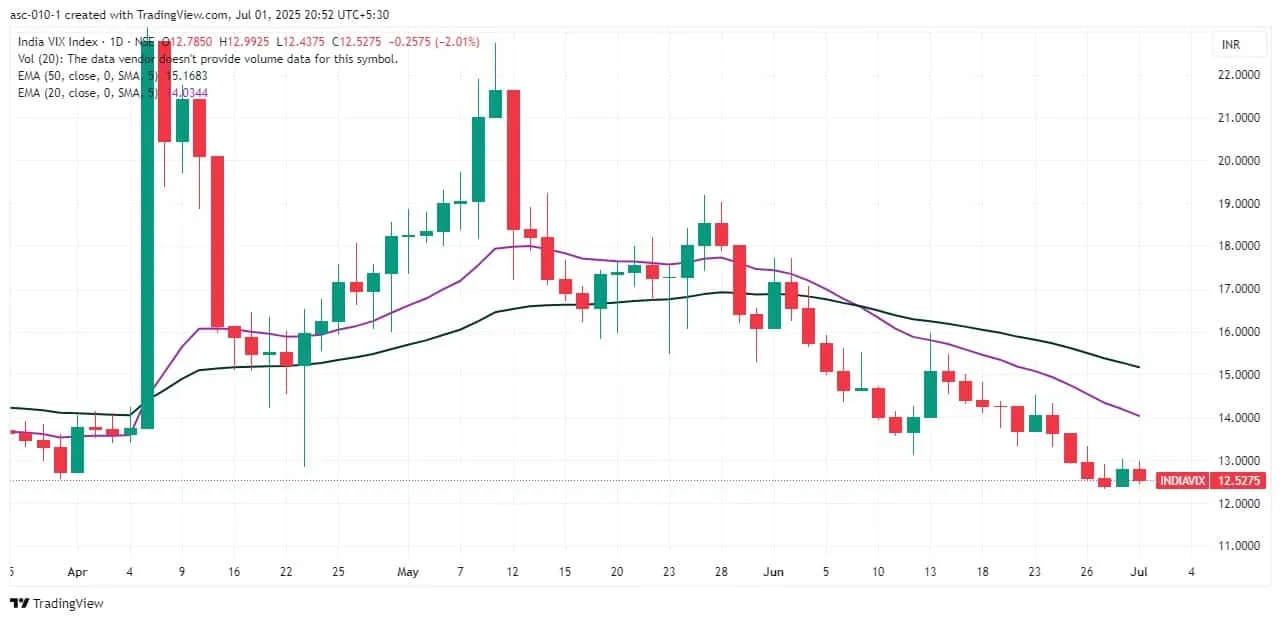 Chart showing the movement of the India VIX volatility index
Futures & Options (F&O) Positions Snapshot
Analysis of F&O positions reveals where traders are building or unwinding leveraged bets.
- Long Build-up: Occurs when both price and open interest increase, suggesting traders are initiating long (buy) positions anticipating price rises. This was seen in 63 stocks.
- Long Unwinding: Happens when price falls and open interest decreases, indicating traders are closing out existing long positions. This was observed in 30 stocks.
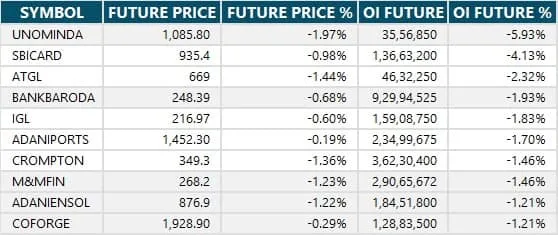 Visual representation of stocks with Long Unwinding positions
- Short Build-up: Characterized by a fall in price and an increase in open interest, suggesting traders are initiating short (sell) positions expecting prices to fall. This was noted in 91 stocks.
- Short-Covering: Happens when price increases and open interest decreases, indicating traders are closing out existing short positions, often leading to upward price movement. This was seen in 41 stocks.
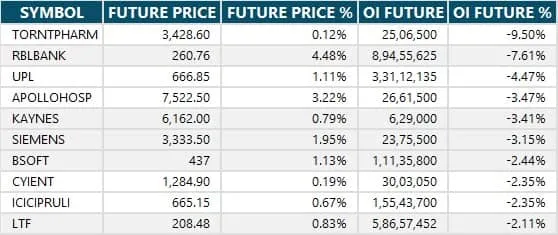 Visual representation of stocks with Short Build-up positions
High Delivery Trades: Stocks with a high share of delivery trades typically reflect longer-term investment interest rather than short-term trading. The specific list highlights where accumulation or distribution might be occurring for the long haul.
Stocks Under F&O Ban: Securities are placed under this ban if their derivative contracts exceed 95 percent of the market-wide position limit. Trading in these contracts is restricted for all market participants until the OI falls below 80 percent. For July 2nd, RBL Bank remains in the F&O ban list. No stocks were added or removed.
Conclusion: Navigating the Day Ahead
The market enters July 2nd with the Nifty showing potential for consolidation, likely testing the 25,650-25,700 resistance zone while finding support around 25,400-25,300. Bank Nifty, however, maintains its bullish momentum near all-time highs. Options data reinforces these technical levels, with significant OI at 26,000 Call and 25,500 Put for Nifty, and 56,000 Put and 56,000/58,000/59,000 Calls for Bank Nifty.
Traders should watch these key levels closely. A decisive break on either side of the expected consolidation range will be crucial for determining the market’s next short-term move. The slight increase in Nifty PCR suggests a cautious positive bias, while a low India VIX indicates reduced fear. Keep an eye on sector-specific movements and global cues for additional direction.
For more detailed market insights and real-time updates, explore related articles on market data, technical analysis, and options trading.