Imagine watching the ground subtly rise or fall, not just during an earthquake, but every day. A new online tool from NASA and the Alaska Satellite Facility makes this visible, mapping land movement across North America down to less than an inch since 2016. This accessible portal unlocks complex satellite data, helping anyone understand how the earth beneath their feet is changing, whether due to natural forces like volcanoes and landslides or human activities like pumping groundwater.
Contents
See the Earth Breathe (or Sink!): What the Tool Does
This powerful web-based tool, formally known as the North America Surface Displacement Product Suite, lets users explore how land is shifting over time. Are buildings sinking? Is the ground lifting near a river? Is a hillside stable? The tool provides high-resolution measurements for areas as small as 200 feet by 200 feet.
This isn’t just about dramatic events like earthquakes. It can show gradual changes caused by volcanic activity, the slow creep of landslides, or even the ground settling or rising as underground water levels change.
Currently covering the U.S. Southwest, northern Mexico, and the New York area, the map will expand to include the rest of the U.S., Central America, and parts of Canada by the end of 2025. With just a few clicks, you can zoom in on a specific location and see a graph showing how much the land has moved over the past several years.
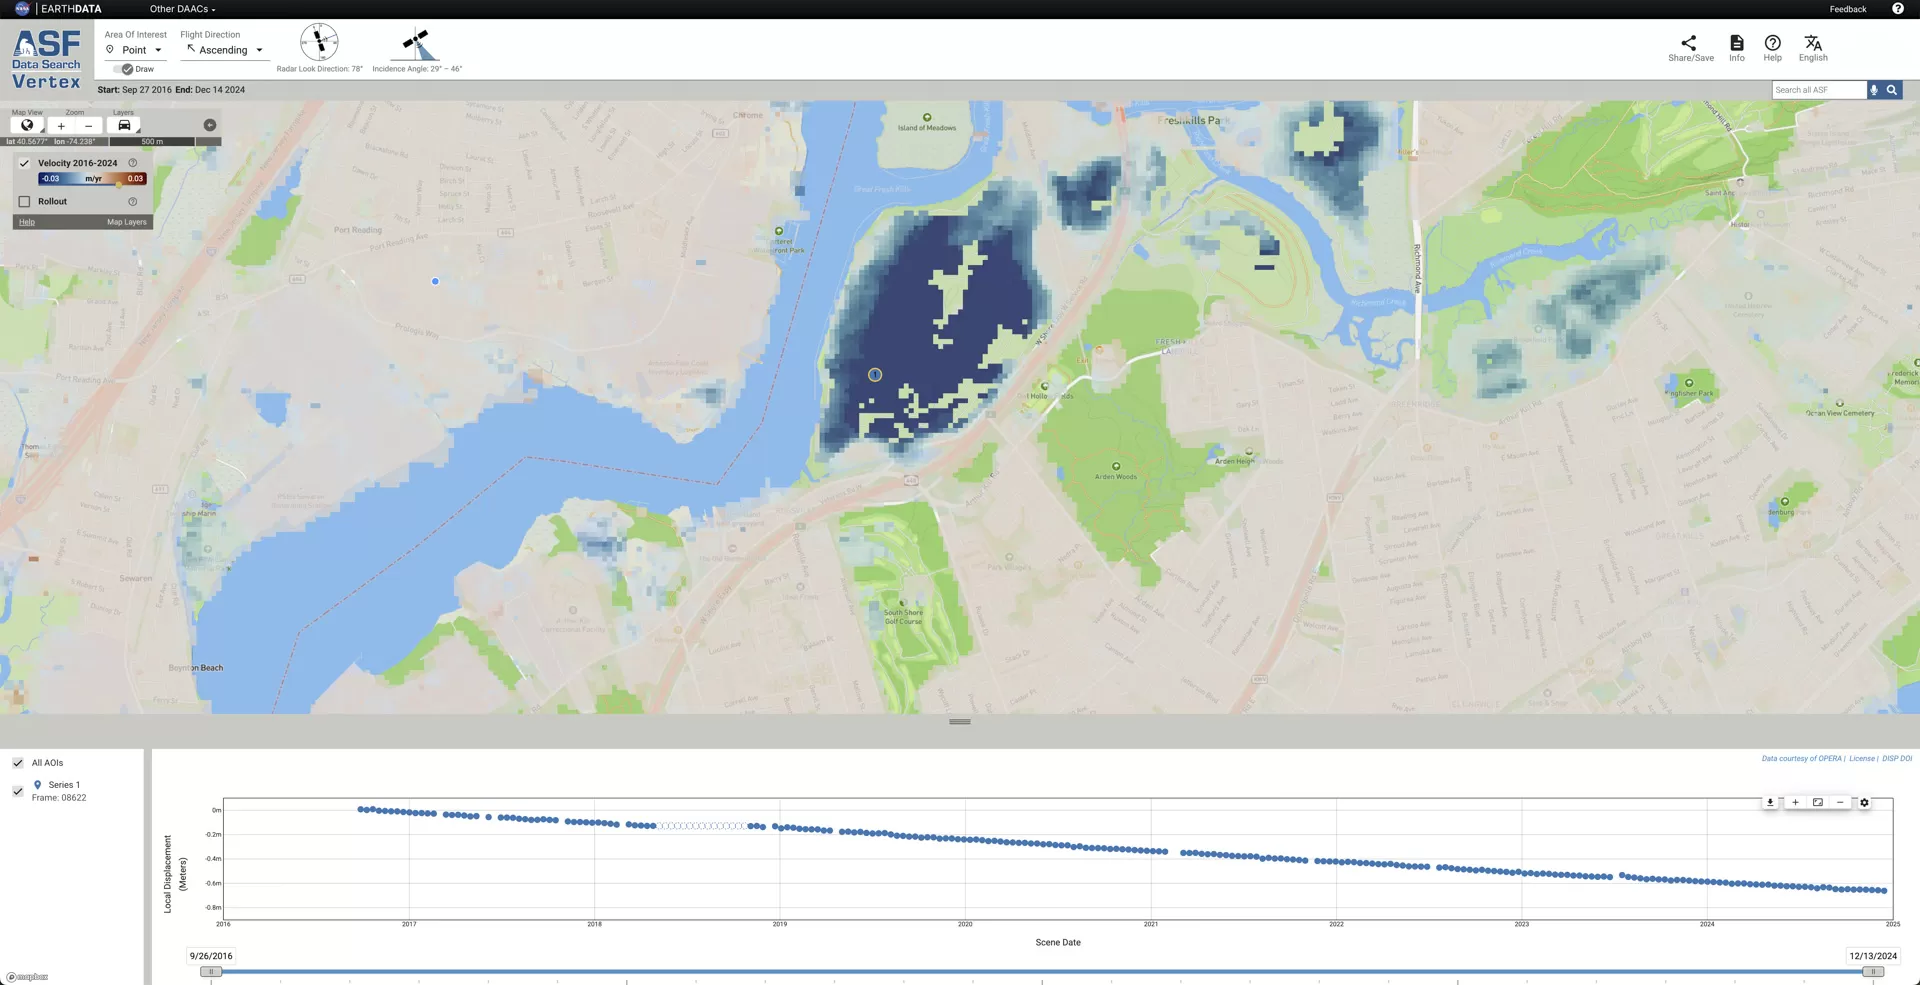 Map showing blue dot on a landfill in Staten Island, NY, indicating land subsidence
For example, the map reveals how land is sinking at Freshkills Park on Staten Island, New York. This park is built on a former landfill, and the sinking is due to the decomposition and settling of buried waste over time.
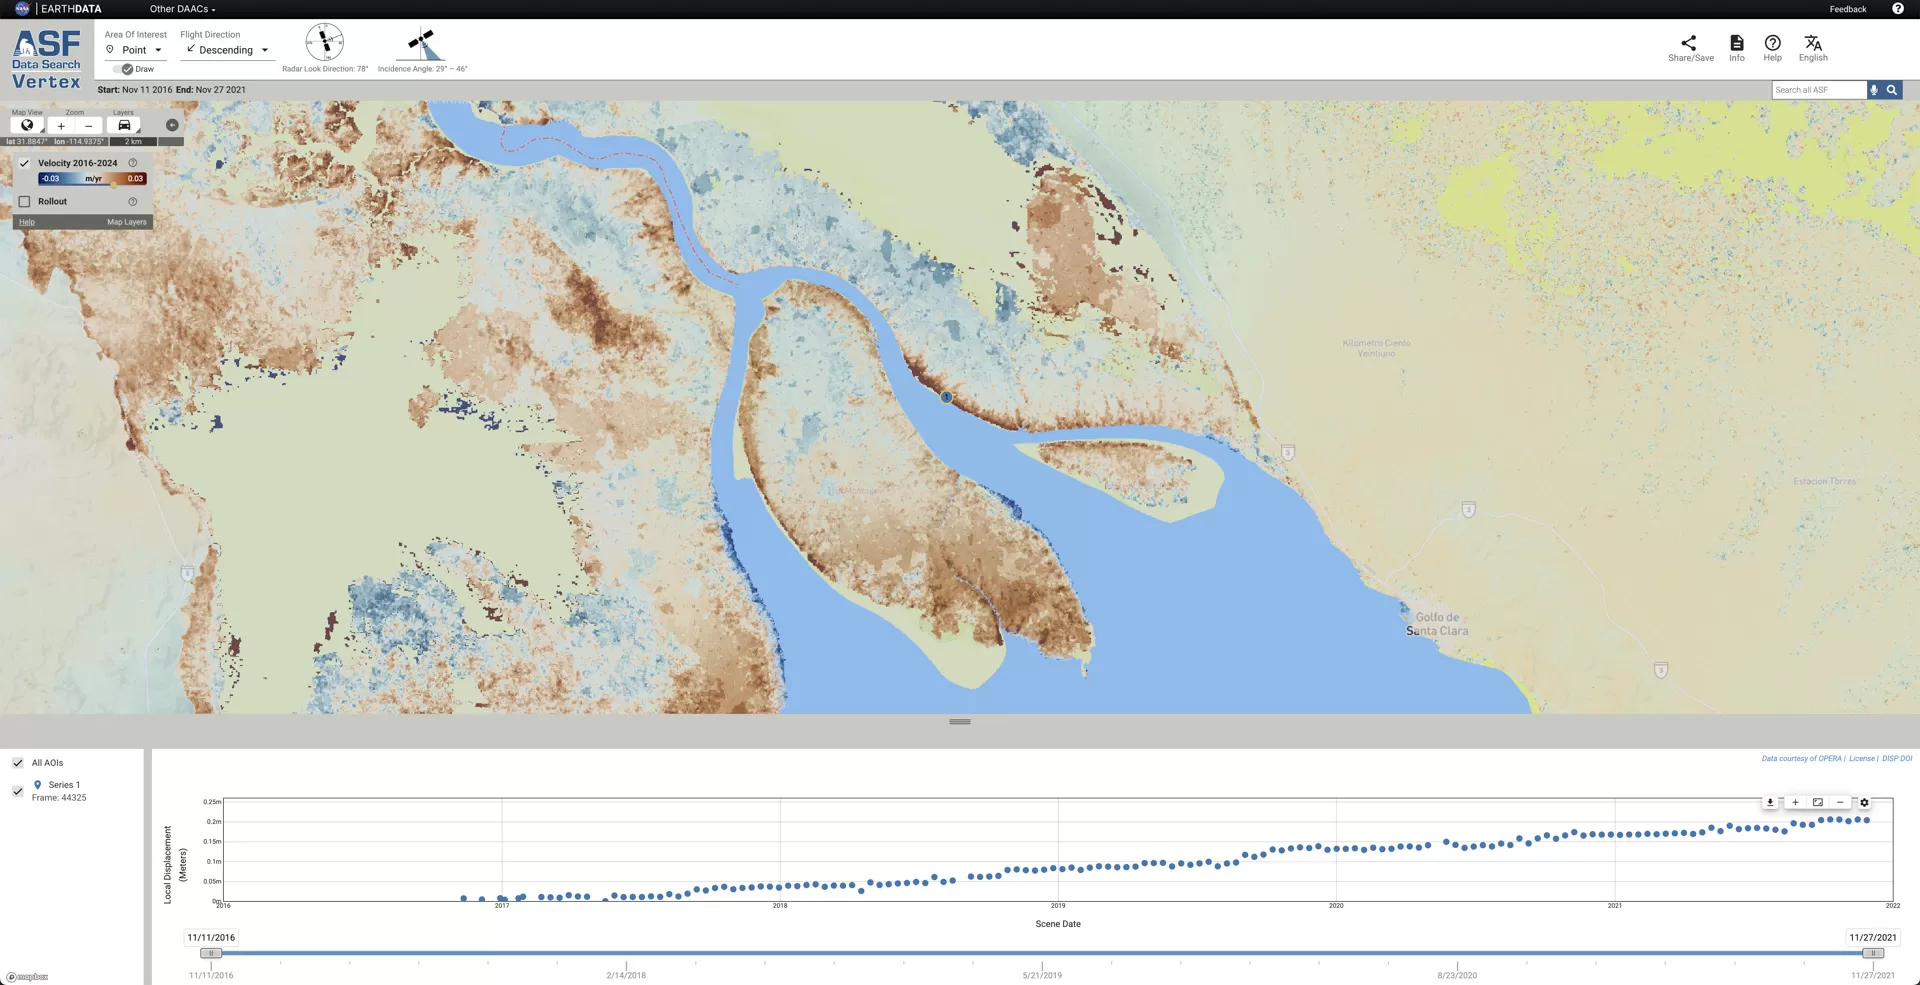 Map showing blue dot at the Colorado River delta outlet to the Gulf of California, indicating land uplift
In contrast, the tool shows land rising at the Colorado River’s outlet to the Gulf of California. This uplift is caused by sediment carried by the river building up the delta over time. Data for a spot there shows the ground has risen about 8 inches (20 centimeters) since 2016.
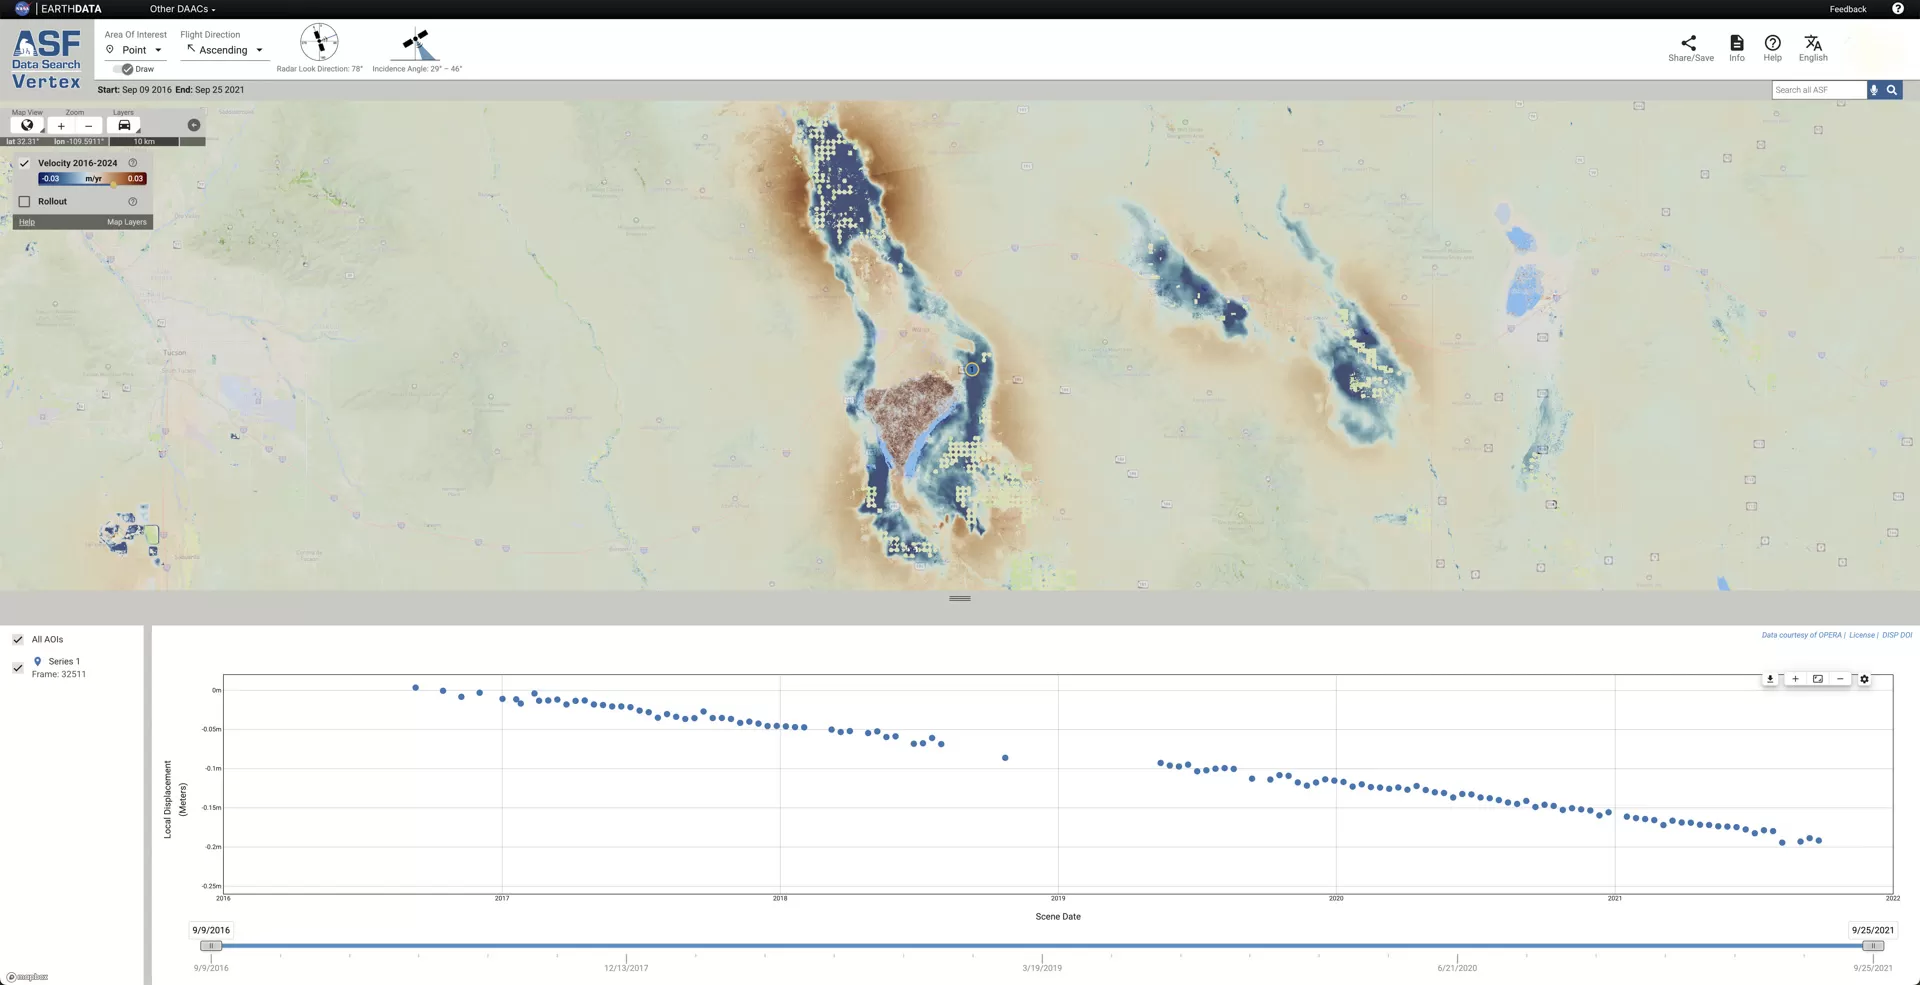 Map showing blue dot near Willcox, Arizona, indicating land subsidence
Near Willcox, Arizona, the map highlights significant sinking, or subsidence. Between 2016 and 2021, the ground subsided about 8 inches (20 centimeters), largely due to the pumping of groundwater in the region.
Bringing Space Data Down to Earth
This mapping is possible thanks to radar satellites orbiting hundreds of miles above us, like the European Space Agency’s Sentinel-1 and NASA’s upcoming NISAR mission. These satellites send microwave pulses down to Earth and measure the signals that bounce back.
By comparing radar images taken of the same spot at different times, scientists can detect tiny changes in the ground’s elevation or position. This technique is called radar interferometry. Imagine looking at a surface with a flashlight, noting the pattern of light and shadow. If the surface slightly buckles, the pattern of light changes, even if the buckle is too small to see directly. Satellite radar does something similar, but with microwave “light” and sophisticated math.
Normally, processing this satellite data requires extensive training and computing power, involving downloading massive amounts of data and running complex analyses. The OPERA project, led by NASA’s Jet Propulsion Laboratory, has automated this entire process.
Real-World Impact: Why This Matters
Making this data easily accessible has significant real-world benefits. State agencies, city planners, and water managers can now quickly use the information without needing to become satellite data experts.
For instance, in Arizona, where groundwater pumping has caused land to sink for decades, water management officials use this kind of data to monitor subsidence. The new portal allows them to quickly see where land is sinking across the state, helping them prioritize areas for more detailed study and inform decisions about managing this vital resource.
This accessible data can also help identify potential hazards like unstable slopes before they become major problems or monitor the effects of resource extraction like oil and gas pumping.
Making Science Accessible
The true power of this new tool is its accessibility. It transforms highly technical satellite measurements into understandable maps and graphs. What once required days or weeks of work by a specialist can now be viewed in seconds with a few mouse clicks.
This project is part of a larger effort by NASA to make satellite data more user-friendly for various applications, from tracking changes in water and ecosystems to monitoring wildfires and deforestation.
What’s Next
As the portal expands its coverage across North America, its value for monitoring Earth’s dynamic surface will only grow. It serves as a powerful reminder that the ground beneath us is not static – it’s constantly, subtly moving, and now we have an unprecedented easy way to see it.